
skip navigation
- BP - Statistical Review data
- Distribution of proved oil reserves - 1987/1997/2007
- Oil proved reserves - 1987/1997/2007
- Oil production by region
- Oil R/P ratios - World
- Oil R/P ratios - by region 2007
- Oil consumption by region
- Regional oil consumption by product group - Light distillates
- Regional oil consumption by product group: Middle distillates
- Regional oil consumption by product group: Fuel oil
- Regional oil consumption by product group: Others
- Distribution of natural gas reserves - 1987/1997/2007
- Natural gas proved reserves: 1987/1997/2007
- Natural gas production by region
- Natural Gas R/P ratios - World
- Natural Gas R/P ratios - By region 2007
- Natural gas consumption by region
- Nuclear energy consumption by region
- Hydroelectricity consumption by region
- Primary energy - World consumption by fuel type
- Spot crude prices: From 1972
- Natural gas prices - From 1984
- Coal prices: from 1988
BP - Statistical Review data
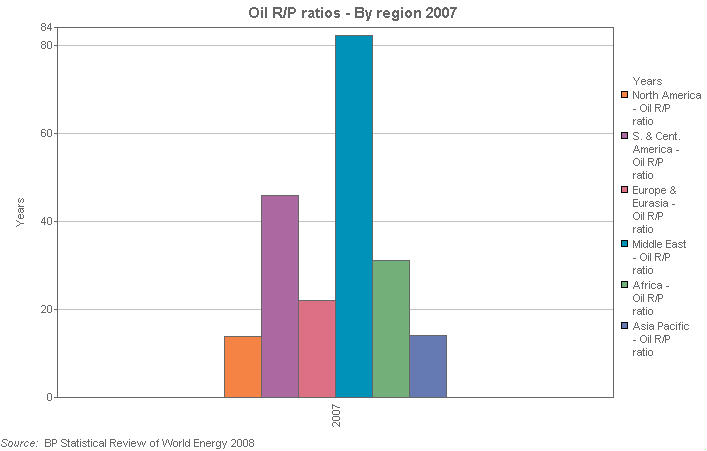
Oil R/P ratios - by region 2007
This clustered bar chart shows world oil R/P (reserve to production) ratios for the year 2007 according to geographic region. R/P ratios are measured in years.
| Units | 2007 | |
|---|---|---|
| Oil: Reserves/Production ratios [3] - Years (from 1980) | Years | |
| North America - Oil R/P ratio | Years | 13.9 |
| S. & Cent. America - Oil R/P ratio | Years | 45.9 |
| Europe & Eurasia - Oil R/P ratio | Years | 22.1 |
| Middle East - Oil R/P ratio | Years | 82.2 |
| Africa - Oil R/P ratio | Years | 31.2 |
| Asia Pacific - Oil R/P ratio | Years | 14.2 |
(3) Reserves/Production (R/P) ratio - If the reserves remaining at the end of any year are divided by the production in that year, the result is the length of time that those remaining reserves would last if production were to continue at that rate.
© 1995-2008 BP p.l.c | Legal Notice