
skip navigation
- BP - Statistical Review data
- Distribution of proved oil reserves - 1987/1997/2007
- Oil proved reserves - 1987/1997/2007
- Oil production by region
- Oil R/P ratios - World
- Oil R/P ratios - by region 2007
- Oil consumption by region
- Regional oil consumption by product group - Light distillates
- Regional oil consumption by product group: Middle distillates
- Regional oil consumption by product group: Fuel oil
- Regional oil consumption by product group: Others
- Distribution of natural gas reserves - 1987/1997/2007
- Natural gas proved reserves: 1987/1997/2007
- Natural gas production by region
- Natural Gas R/P ratios - World
- Natural Gas R/P ratios - By region 2007
- Natural gas consumption by region
- Nuclear energy consumption by region
- Hydroelectricity consumption by region
- Primary energy - World consumption by fuel type
- Spot crude prices: From 1972
- Natural gas prices - From 1984
- Coal prices: from 1988
BP - Statistical Review data
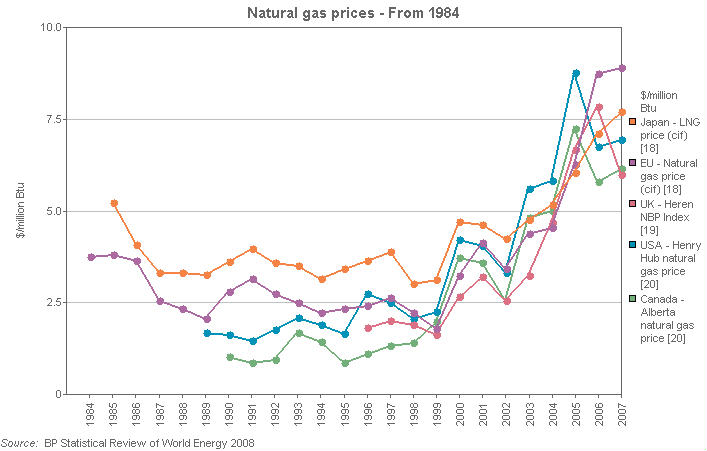
Natural gas prices - From 1984
This line chart shows natural gas prices for Japan, EU, UK, USA and Canada for the years 1984 to 2007. Natural gas prices are measured in $/million Btu (US dollars per million British thermal units).
| Units | 1984 | 1985 | 1986 | 1987 | 1988 | 1989 | 1990 | 1991 | 1992 | 1993 | 1994 | 1995 | |
|---|---|---|---|---|---|---|---|---|---|---|---|---|---|
| Gas: Prices - US dollars per million British thermal units (from 1984) [18,19,20] | $/million Btu | ||||||||||||
| Japan - LNG price (cif) [18] | $/million Btu | 5.2 | 4.1 | 3.4 | 3.3 | 3.3 | 3.6 | 4.0 | 3.6 | 3.5 | 3.2 | 3.5 | |
| EU - Natural gas price (cif) [18] | $/million Btu | 3.8 | 3.8 | 3.7 | 2.6 | 2.4 | 2.1 | 2.8 | 3.2 | 2.8 | 2.5 | 2.2 | 2.4 |
| UK - Heren NBP Index [19] | $/million Btu | ||||||||||||
| USA - Henry Hub natural gas price [20] | $/million Btu | 1.7 | 1.6 | 1.5 | 1.8 | 2.1 | 1.9 | 1.7 | |||||
| Canada - Alberta natural gas price [20] | $/million Btu | 1.0 | 0.9 | 1.0 | 1.7 | 1.5 | 0.9 |
| Units | 1996 | 1997 | 1998 | 1999 | 2000 | 2001 | 2002 | 2003 | 2004 | 2005 | 2006 | 2007 | |
|---|---|---|---|---|---|---|---|---|---|---|---|---|---|
| Gas: Prices - US dollars per million British thermal units (from 1984) [18,19,20] | $/million Btu | ||||||||||||
| Japan - LNG price (cif) [18] | $/million Btu | 3.7 | 3.9 | 3.0 | 3.1 | 4.7 | 4.6 | 4.3 | 4.8 | 5.2 | 6.0 | 7.1 | 7.7 |
| EU - Natural gas price (cif) [18] | $/million Btu | 2.4 | 2.6 | 2.3 | 1.8 | 3.2 | 4.2 | 3.5 | 4.4 | 4.6 | 6.3 | 8.8 | 8.9 |
| UK - Heren NBP Index [19] | $/million Btu | 1.8 | 2.0 | 1.9 | 1.6 | 2.7 | 3.2 | 2.6 | 3.3 | 4.7 | 6.7 | 7.9 | 6.0 |
| USA - Henry Hub natural gas price [20] | $/million Btu | 2.8 | 2.5 | 2.1 | 2.3 | 4.2 | 4.1 | 3.3 | 5.6 | 5.8 | 8.8 | 6.8 | 7.0 |
| Canada - Alberta natural gas price [20] | $/million Btu | 1.1 | 1.4 | 1.4 | 2.0 | 3.7 | 3.6 | 2.6 | 4.8 | 5.0 | 7.2 | 5.8 | 6.2 |
(18) cif = cost+insurance+freight (average prices).
(19) Price is for NBP Day-Ahead Index. Source: Heren Energy Ltd
(20) Source: Natural Gas Week.
© 1995-2008 BP p.l.c | Legal Notice