
- BP - Statistical Review data
- Distribution of proved oil reserves - 1987/1997/2007
- Oil proved reserves - 1987/1997/2007
- Oil production by region
- Oil R/P ratios - World
- Oil R/P ratios - by region 2007
- Oil consumption by region
- Regional oil consumption by product group - Light distillates
- Regional oil consumption by product group: Middle distillates
- Regional oil consumption by product group: Fuel oil
- Regional oil consumption by product group: Others
- Distribution of natural gas reserves - 1987/1997/2007
- Natural gas proved reserves: 1987/1997/2007
- Natural gas production by region
- Natural Gas R/P ratios - World
- Natural Gas R/P ratios - By region 2007
- Natural gas consumption by region
- Nuclear energy consumption by region
- Hydroelectricity consumption by region
- Primary energy - World consumption by fuel type
- Spot crude prices: From 1972
- Natural gas prices - From 1984
- Coal prices: from 1988
BP - Statistical Review data
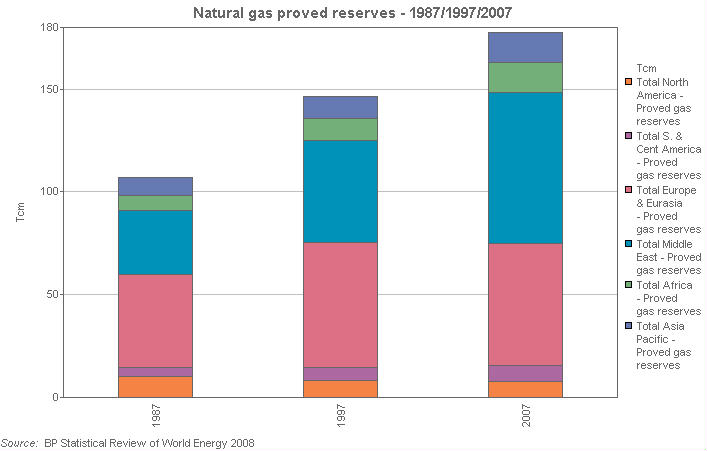
Natural gas proved reserves: 1987/1997/2007
This stacked bar chart shows the world natural gas proved reserves according to geographic region for the years 1987, 1997 and 2007. Natural gas proved reserves are measured in Tcm (trillion cubic metres).
| Units | 1987 | 1997 | 2007 | |
|---|---|---|---|---|
| Gas: Proved reserves [15] - Trillion cubic metres (from 1980) | Tcm | |||
| Total North America - Proved gas reserves | Tcm | 10.11 | 8.34 | 7.98 |
| Total S. & Cent America - Proved gas reserves | Tcm | 4.67 | 6.21 | 7.73 |
| Total Europe & Eurasia - Proved gas reserves | Tcm | 45.06 | 61.02 | 59.41 |
| Total Middle East - Proved gas reserves | Tcm | 31.18 | 49.53 | 73.21 |
| Total Africa - Proved gas reserves | Tcm | 7.39 | 10.62 | 14.58 |
| Total Asia Pacific - Proved gas reserves | Tcm | 8.45 | 10.73 | 14.46 |
(1) Proved reserves are generally taken to be those quantities that geological and engineering information indicates with reasonable certainty can be recovered in the future from known reservoirs/deposits under existing economic and operating conditions.
(14) Source of data: The estimates in this table have been compiled using a combination of primary official sources, third-party data from Cedigaz.
(15) Trillion equals one million million (1012). 1 trillion cubic feet of natural gas = 26 million tonnes of oil (approximately).
© 1995-2008 BP p.l.c | Legal Notice