
skip navigation
- BP - Statistical Review data
- Distribution of proved oil reserves - 1987/1997/2007
- Oil proved reserves - 1987/1997/2007
- Oil production by region
- Oil R/P ratios - World
- Oil R/P ratios - by region 2007
- Oil consumption by region
- Regional oil consumption by product group - Light distillates
- Regional oil consumption by product group: Middle distillates
- Regional oil consumption by product group: Fuel oil
- Regional oil consumption by product group: Others
- Distribution of natural gas reserves - 1987/1997/2007
- Natural gas proved reserves: 1987/1997/2007
- Natural gas production by region
- Natural Gas R/P ratios - World
- Natural Gas R/P ratios - By region 2007
- Natural gas consumption by region
- Nuclear energy consumption by region
- Hydroelectricity consumption by region
- Primary energy - World consumption by fuel type
- Spot crude prices: From 1972
- Natural gas prices - From 1984
- Coal prices: from 1988
BP - Statistical Review data
Nuclear energy consumption by region
This stacked area chart shows world nuclear energy consumption according to geographic region for the years from 1982 to 2007. Nuclear energy consumption is measured in Mtoe (million tonnes oil equivalent)
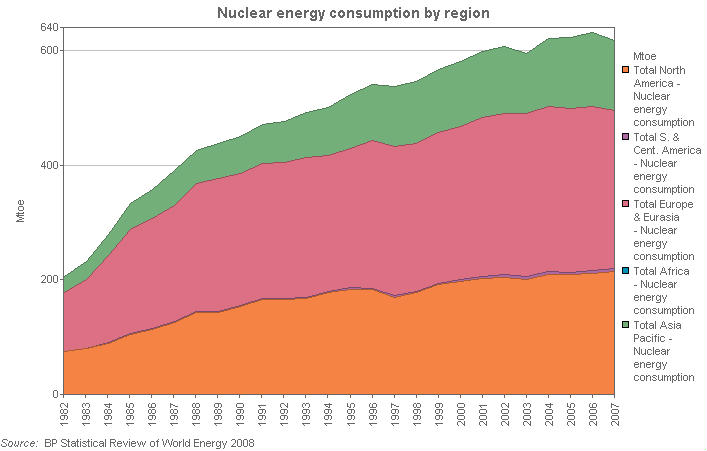
| Units | 1982 | 1983 | 1984 | 1985 | 1986 | 1987 | 1988 | 1989 | 1990 | 1991 | 1992 | 1993 | 1994 | |
|---|---|---|---|---|---|---|---|---|---|---|---|---|---|---|
| Nuclear Energy: Consumption [25] - Million tonnes oil equivalent (from 1965) | Mtoe | |||||||||||||
| Total North America - Nuclear energy consumption | Mtoe | 76.0 | 81.0 | 89.9 | 105.1 | 114.7 | 125.9 | 144.3 | 144.2 | 154.6 | 166.1 | 166.5 | 167.7 | 177.9 |
| Total S. & Cent. America - Nuclear energy consumption | Mtoe | 0.4 | 0.8 | 1.4 | 2.1 | 1.3 | 1.7 | 1.4 | 1.6 | 2.2 | 2.1 | 2.0 | 1.9 | 1.9 |
| Total Europe & Eurasia - Nuclear energy consumption | Mtoe | 102.8 | 119.6 | 151.5 | 181.1 | 191.7 | 203.3 | 223.1 | 231.9 | 229.2 | 234.8 | 236.4 | 244.6 | 237.6 |
| Total Africa - Nuclear energy consumption | Mtoe | |||||||||||||
| Total Asia Pacific - Nuclear energy consumption | Mtoe | 28.2 | 31.7 | 37.9 | 45.8 | 51.4 | 60.5 | 57.0 | 60.3 | 65.2 | 69.4 | 71.4 | 79.1 | 84.5 |
| Units | 1995 | 1996 | 1997 | 1998 | 1999 | 2000 | 2001 | 2002 | 2003 | 2004 | 2005 | 2006 | 2007 | |
|---|---|---|---|---|---|---|---|---|---|---|---|---|---|---|
| Nuclear Energy: Consumption [25] - Million tonnes oil equivalent (from 1965) | Mtoe | |||||||||||||
| Total North America - Nuclear energy consumption | Mtoe | 184.4 | 183.5 | 170.8 | 178.7 | 192.4 | 197.9 | 202.5 | 205.1 | 201.2 | 210.3 | 209.5 | 212.0 | 215.6 |
| Total S. & Cent. America - Nuclear energy consumption | Mtoe | 2.2 | 2.2 | 2.5 | 2.4 | 2.5 | 2.8 | 4.8 | 4.4 | 4.7 | 4.4 | 3.8 | 4.8 | 4.4 |
| Total Europe & Eurasia - Nuclear energy consumption | Mtoe | 243.7 | 258.6 | 260.8 | 257.3 | 263.1 | 267.4 | 276.3 | 280.8 | 285.0 | 288.2 | 285.5 | 287.2 | 275.6 |
| Total Africa - Nuclear energy consumption | Mtoe | |||||||||||||
| Total Asia Pacific - Nuclear energy consumption | Mtoe | 93.0 | 97.8 | 104.1 | 108.5 | 110.2 | 113.3 | 114.8 | 117.7 | 104.6 | 119.0 | 125.2 | 128.6 | 123.4 |
(25) Based on gross generation and not accounting for cross border electricity supply. Converted on the basis of thermal equivalence assuming 38% conversion efficiency in a modern thermal power station.
© 1995-2008 BP p.l.c | Legal Notice