
skip navigation
- BP - Statistical Review data
- Distribution of proved oil reserves - 1987/1997/2007
- Oil proved reserves - 1987/1997/2007
- Oil production by region
- Oil R/P ratios - World
- Oil R/P ratios - by region 2007
- Oil consumption by region
- Regional oil consumption by product group - Light distillates
- Regional oil consumption by product group: Middle distillates
- Regional oil consumption by product group: Fuel oil
- Regional oil consumption by product group: Others
- Distribution of natural gas reserves - 1987/1997/2007
- Natural gas proved reserves: 1987/1997/2007
- Natural gas production by region
- Natural Gas R/P ratios - World
- Natural Gas R/P ratios - By region 2007
- Natural gas consumption by region
- Nuclear energy consumption by region
- Hydroelectricity consumption by region
- Primary energy - World consumption by fuel type
- Spot crude prices: From 1972
- Natural gas prices - From 1984
- Coal prices: from 1988
BP - Statistical Review data
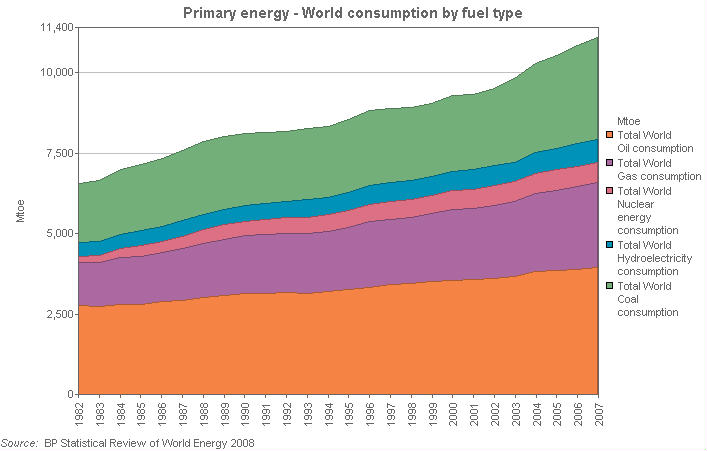
Primary energy - World consumption by fuel type
This stacked area chart shows world primary energy consumption by fuel type for the years from 1982 to 2007. Primary energy consumption is measured in Mtoe (million tonnes oil equivalent).
| Units | 1982 | 1983 | 1984 | 1985 | 1986 | 1987 | 1988 | 1989 | 1990 | 1991 | 1992 | 1993 | 1994 | |
|---|---|---|---|---|---|---|---|---|---|---|---|---|---|---|
| Oil: Consumption [5,6] - Million tonnes (from 1965) | Mtoe | |||||||||||||
| Total World Oil consumption | Mtoe | 2,781.9 | 2,764.5 | 2,817.7 | 2,808.0 | 2,892.7 | 2,949.3 | 3,041.8 | 3,094.3 | 3,154.9 | 3,149.1 | 3,186.3 | 3,162.9 | 3,218.6 |
| Gas: Consumption - Million tonnes oil equivalent (from 1965) [17] | Mtoe | |||||||||||||
| Total World Gas consumption | Mtoe | 1,328.3 | 1,342.5 | 1,454.2 | 1,501.4 | 1,518.8 | 1,596.0 | 1,672.2 | 1,747.2 | 1,788.0 | 1,824.2 | 1,834.7 | 1,866.3 | 1,874.0 |
| Nuclear Energy: Consumption [25] - Million tonnes oil equivalent (from 1965) | Mtoe | |||||||||||||
| Total World Nuclear energy consumption | Mtoe | 207.4 | 233.0 | 281.6 | 335.3 | 361.3 | 392.9 | 428.4 | 440.6 | 453.2 | 474.6 | 478.5 | 495.0 | 504.2 |
| Hydroelectricty: Consumption [25] - Million tonnes oil equivalent (from 1965) | Mtoe | |||||||||||||
| Total World Hydroelectricity consumption | Mtoe | 410.8 | 430.5 | 444.8 | 453.5 | 459.0 | 466.9 | 478.7 | 478.1 | 495.2 | 507.1 | 507.6 | 537.3 | 540.3 |
| Coal: Consumption [21] - Million tonnes oil equivalent (from 1965) | Mtoe | |||||||||||||
| Total World Coal consumption | Mtoe | 1,856.0 | 1,901.2 | 1,994.2 | 2,075.8 | 2,118.9 | 2,194.1 | 2,254.3 | 2,268.6 | 2,229.4 | 2,209.5 | 2,190.9 | 2,204.8 | 2,215.5 |
| Units | 1995 | 1996 | 1997 | 1998 | 1999 | 2000 | 2001 | 2002 | 2003 | 2004 | 2005 | 2006 | 2007 | |
|---|---|---|---|---|---|---|---|---|---|---|---|---|---|---|
| Oil: Consumption [5,6] - Million tonnes (from 1965) | Mtoe | |||||||||||||
| Total World Oil consumption | Mtoe | 3,264.2 | 3,346.6 | 3,433.3 | 3,449.3 | 3,518.1 | 3,558.7 | 3,576.2 | 3,611.3 | 3,681.8 | 3,823.7 | 3,871.0 | 3,910.9 | 3,952.8 |
| Gas: Consumption - Million tonnes oil equivalent (from 1965) [17] | Mtoe | |||||||||||||
| Total World Gas consumption | Mtoe | 1,936.0 | 2,029.8 | 2,026.4 | 2,059.1 | 2,108.4 | 2,199.3 | 2,216.6 | 2,287.5 | 2,341.1 | 2,427.6 | 2,496.8 | 2,558.3 | 2,637.7 |
| Nuclear Energy: Consumption [25] - Million tonnes oil equivalent (from 1965) | Mtoe | |||||||||||||
| Total World Nuclear energy consumption | Mtoe | 526.1 | 545.0 | 541.3 | 550.2 | 571.2 | 584.5 | 600.9 | 610.9 | 598.7 | 625.4 | 627.0 | 634.9 | 622.0 |
| Hydroelectricty: Consumption [25] - Million tonnes oil equivalent (from 1965) | Mtoe | |||||||||||||
| Total World Hydroelectricity consumption | Mtoe | 570.2 | 578.7 | 588.7 | 597.1 | 602.1 | 610.4 | 596.3 | 607.8 | 607.7 | 644.7 | 670.4 | 697.2 | 709.2 |
| Coal: Consumption [21] - Million tonnes oil equivalent (from 1965) | Mtoe | |||||||||||||
| Total World Coal consumption | Mtoe | 2,268.4 | 2,337.8 | 2,317.7 | 2,264.1 | 2,252.9 | 2,340.4 | 2,351.7 | 2,406.7 | 2,599.7 | 2,768.1 | 2,892.4 | 3,041.7 | 3,177.5 |
(26) Primary energy comprises commercially traded fuels only. Excluded, therefore, are fuels such as wood, peat and animal waste which, though important in many countries, are unreliably documented in terms of consumption statistics. Also excluded are wind, geothermal and solar power generation.
© 1995-2008 BP p.l.c | Legal Notice