
skip navigation
- BP - Statistical Review data
- Distribution of proved oil reserves - 1987/1997/2007
- Oil proved reserves - 1987/1997/2007
- Oil production by region
- Oil R/P ratios - World
- Oil R/P ratios - by region 2007
- Oil consumption by region
- Regional oil consumption by product group - Light distillates
- Regional oil consumption by product group: Middle distillates
- Regional oil consumption by product group: Fuel oil
- Regional oil consumption by product group: Others
- Distribution of natural gas reserves - 1987/1997/2007
- Natural gas proved reserves: 1987/1997/2007
- Natural gas production by region
- Natural Gas R/P ratios - World
- Natural Gas R/P ratios - By region 2007
- Natural gas consumption by region
- Nuclear energy consumption by region
- Hydroelectricity consumption by region
- Primary energy - World consumption by fuel type
- Spot crude prices: From 1972
- Natural gas prices - From 1984
- Coal prices: from 1988
BP - Statistical Review data
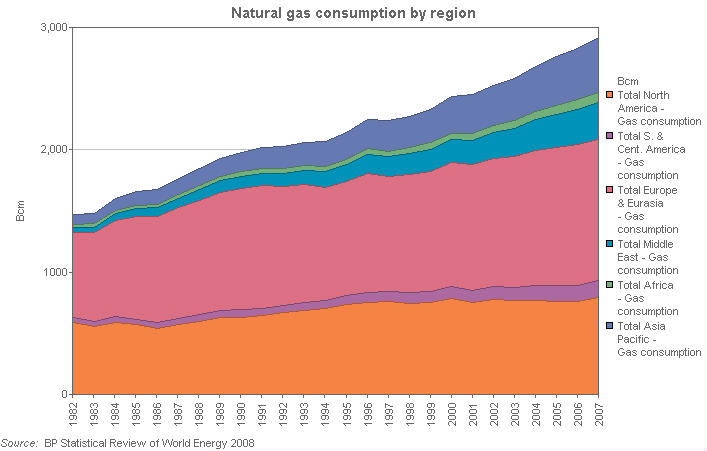
Natural gas consumption by region
This stacked area chart shows world natural gas consumption according to geographic region for the years from 1982 to 2007. Natural gas consumption is measured in Bcm (billion cubic metres).
| Units | 1982 | 1983 | 1984 | 1985 | 1986 | 1987 | 1988 | 1989 | 1990 | 1991 | 1992 | 1993 | 1994 | |
|---|---|---|---|---|---|---|---|---|---|---|---|---|---|---|
| Gas: Consumption - Billion cubic metres (from 1965) [17] | Bcm | |||||||||||||
| Total North America - Gas consumption | Bcm | 592.4 | 556.8 | 593.1 | 574.4 | 543.3 | 572.4 | 600.9 | 637.0 | 637.3 | 649.8 | 673.4 | 691.1 | 707.1 |
| Total S. & Cent. America - Gas consumption | Bcm | 39.9 | 41.7 | 45.0 | 46.0 | 49.7 | 49.7 | 54.5 | 56.5 | 58.4 | 59.0 | 61.0 | 64.5 | 67.1 |
| Total Europe & Eurasia - Gas consumption | Bcm | 697.7 | 731.7 | 787.0 | 841.2 | 864.4 | 907.4 | 935.6 | 961.1 | 994.1 | 1,004.9 | 966.0 | 963.3 | 921.7 |
| Total Middle East - Gas consumption | Bcm | 39.4 | 42.8 | 56.0 | 60.5 | 72.5 | 76.6 | 87.4 | 95.3 | 95.5 | 98.0 | 110.6 | 119.0 | 130.6 |
| Total Africa - Gas consumption | Bcm | 24.6 | 27.5 | 27.1 | 28.1 | 31.1 | 32.0 | 35.6 | 36.9 | 38.1 | 38.2 | 40.3 | 39.9 | 41.9 |
| Total Asia Pacific - Gas consumption | Bcm | 77.7 | 85.7 | 100.9 | 111.8 | 121.4 | 128.6 | 138.0 | 147.1 | 157.2 | 170.1 | 180.2 | 190.2 | 207.1 |
| Units | 1995 | 1996 | 1997 | 1998 | 1999 | 2000 | 2001 | 2002 | 2003 | 2004 | 2005 | 2006 | 2007 | |
|---|---|---|---|---|---|---|---|---|---|---|---|---|---|---|
| Gas: Consumption - Billion cubic metres (from 1965) [17] | Bcm | |||||||||||||
| Total North America - Gas consumption | Bcm | 739.4 | 755.4 | 763.3 | 749.4 | 758.6 | 791.8 | 755.6 | 783.1 | 773.0 | 776.2 | 767.6 | 761.4 | 801.0 |
| Total S. & Cent. America - Gas consumption | Bcm | 73.2 | 81.3 | 82.7 | 89.4 | 88.8 | 95.1 | 99.8 | 101.2 | 106.0 | 117.3 | 124.3 | 131.3 | 134.5 |
| Total Europe & Eurasia - Gas consumption | Bcm | 929.4 | 976.4 | 936.3 | 960.3 | 982.9 | 1,013.5 | 1,025.5 | 1,045.6 | 1,070.7 | 1,104.3 | 1,128.3 | 1,151.5 | 1,155.7 |
| Total Middle East - Gas consumption | Bcm | 141.8 | 150.7 | 164.9 | 173.7 | 180.1 | 185.4 | 198.4 | 215.1 | 226.1 | 252.8 | 276.8 | 291.4 | 299.4 |
| Total Africa - Gas consumption | Bcm | 44.8 | 47.2 | 46.1 | 47.7 | 51.2 | 55.5 | 59.5 | 60.8 | 66.4 | 70.8 | 73.3 | 77.9 | 83.5 |
| Total Asia Pacific - Gas consumption | Bcm | 216.6 | 238.0 | 251.8 | 258.1 | 274.1 | 296.1 | 316.1 | 327.8 | 348.8 | 367.9 | 395.0 | 420.9 | 447.8 |
(17) As far as possible, the data represents standard volumes (measured at 15°C and 1013 mbar); as it is derived directly from tonnes of oil equivalent using an average conversion factor, it does not necessarily equate with gas volumes expressed in specific national terms.
© 1995-2008 BP p.l.c | Legal Notice