
skip navigation
- BP - Statistical Review data
- Distribution of proved oil reserves - 1986/1996/2006
- Oil proved reserves - 1986/1996/2006
- Oil production by area
- Oil R/P ratios - World
- Oil R/P ratios - by region 2006
- Oil consumption by area
- Regional oil consumption by product group - Light distillates
- Regional oil consumption by product group: Middle distillates
- Regional oil consumption by product group: Fuel oils
- Regional oil consumption by product group: Others
- Distribution of natural gas reserves - 1986/1996/2006
- Natural gas proved reserves: 1986/1996/2006
- Natural gas production by area
- Natural Gas R/P ratios - World
- Natural Gas R/P ratios - By region 2006
- Natural gas consumption by area
- Nuclear energy consumption by area
- Hydroelectricity consumption by area
- Primary energy - World consumption by fuel type
- Spot crude prices: From 1972
- Natural gas prices - From 1984
- Coal prices: from 1987
BP Statistical Review charting tool
Distribution of natural gas reserves - 1986/1996/2006
These pie charts show the
percentage
distribution of world natural gas reserves according to geographic region for the years 1986, 1996 and 2006.
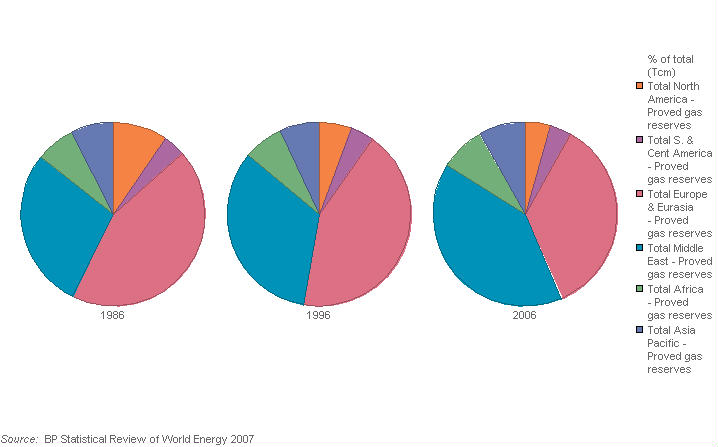
| Units | 1986 | 1996 | 2006 | |
|---|---|---|---|---|
| Gas: Proved reserves [15] - Trillion cubic metres (from 1980) | % of total (Tcm) | |||
| Total North America - Proved gas reserves | % of total (Tcm) | 9.5 | 5.7 | 4.4 |
| Total S. & Cent America - Proved gas reserves | % of total (Tcm) | 3.9 | 4.1 | 3.8 |
| Total Europe & Eurasia - Proved gas reserves | % of total (Tcm) | 43.9 | 43.0 | 35.3 |
| Total Middle East - Proved gas reserves | % of total (Tcm) | 28.2 | 33.3 | 40.5 |
| Total Africa - Proved gas reserves | % of total (Tcm) | 6.9 | 6.9 | 7.8 |
| Total Asia Pacific - Proved gas reserves | % of total (Tcm) | 7.6 | 7.0 | 8.2 |
(1) Proved reserves are generally taken to be those quantities that geological and engineering information indicates with reasonable certainty can be recovered in the future from known reservoirs/deposits under existing economic and operating conditions.
(15) Trillion equals one million million (1012). 1 trillion cubic feet of natural gas = 26 million tonnes of oil (approximately).
© 1995-2007 BP p.l.c | Legal Notice