
skip navigation
- BP - Statistical Review data
- Distribution of proved oil reserves - 1986/1996/2006
- Oil proved reserves - 1986/1996/2006
- Oil production by area
- Oil R/P ratios - World
- Oil R/P ratios - by region 2006
- Oil consumption by area
- Regional oil consumption by product group - Light distillates
- Regional oil consumption by product group: Middle distillates
- Regional oil consumption by product group: Fuel oils
- Regional oil consumption by product group: Others
- Distribution of natural gas reserves - 1986/1996/2006
- Natural gas proved reserves: 1986/1996/2006
- Natural gas production by area
- Natural Gas R/P ratios - World
- Natural Gas R/P ratios - By region 2006
- Natural gas consumption by area
- Nuclear energy consumption by area
- Hydroelectricity consumption by area
- Primary energy - World consumption by fuel type
- Spot crude prices: From 1972
- Natural gas prices - From 1984
- Coal prices: from 1987
BP Statistical Review charting tool
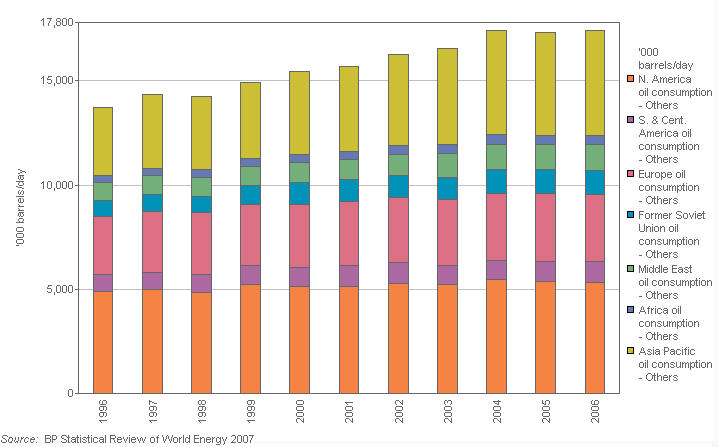
Regional oil consumption by product group: Others
This stacked bar chart shows world consumption of other oil product groups according to geographic region for years from 1996 to 2006. Other oil product group consumption is measured in thousands of barrels per day.
| Units | 1996 | 1997 | 1998 | 1999 | 2000 | 2001 | 2002 | 2003 | 2004 | 2005 | 2006 | |
|---|---|---|---|---|---|---|---|---|---|---|---|---|
| Oil: Regional consumption - by product group - Thousand barrels daily (from 1965) [5,6] | '000 barrels/day | |||||||||||
| Total North America - Oil consumption | '000 barrels/day | 21,823 | 22,276 | 22,674 | 23,286 | 23,548 | 23,571 | 23,665 | 24,050 | 24,898 | 25,023 | 24,783 |
| N. America oil consumption - Others | '000 barrels/day | 4,893 | 4,967 | 4,869 | 5,245 | 5,112 | 5,137 | 5,278 | 5,243 | 5,446 | 5,358 | 5,340 |
| Total S. & Cent. America - Oil consumption | '000 barrels/day | 4,543 | 4,774 | 4,914 | 4,939 | 4,861 | 4,924 | 4,892 | 4,725 | 4,826 | 5,006 | 5,152 |
| S. & Cent. America oil consumption - Others | '000 barrels/day | 807 | 829 | 858 | 894 | 918 | 1,011 | 1,002 | 908 | 953 | 970 | 994 |
| Total Europe - Oil consumption | '000 barrels/day | 15,646 | 15,848 | 16,086 | 16,042 | 15,942 | 16,116 | 16,059 | 16,157 | 16,349 | 16,495 | 16,486 |
| Europe oil consumption - Others | '000 barrels/day | 2,792 | 2,932 | 2,946 | 2,945 | 3,047 | 3,052 | 3,103 | 3,137 | 3,212 | 3,283 | 3,226 |
| Total Former Soviet Union oil consumption | '000 barrels/day | 3,910 | 3,890 | 3,741 | 3,700 | 3,623 | 3,627 | 3,667 | 3,748 | 3,783 | 3,819 | 3,997 |
| Former Soviet Union oil consumption - Others | '000 barrels/day | 791 | 840 | 775 | 882 | 1,053 | 1,062 | 1,066 | 1,080 | 1,159 | 1,132 | 1,139 |
| Total Middle East Oil consumption | '000 barrels/day | 4,370 | 4,457 | 4,522 | 4,599 | 4,735 | 4,854 | 5,047 | 5,238 | 5,492 | 5,712 | 5,923 |
| Middle East oil consumption - Others | '000 barrels/day | 845 | 881 | 936 | 923 | 948 | 960 | 1,034 | 1,132 | 1,192 | 1,211 | 1,254 |
| Total Africa - Oil consumption | '000 barrels/day | 2,239 | 2,307 | 2,388 | 2,448 | 2,458 | 2,473 | 2,510 | 2,567 | 2,645 | 2,731 | 2,790 |
| Africa oil consumption - Others | '000 barrels/day | 350 | 364 | 376 | 389 | 395 | 407 | 428 | 438 | 454 | 422 | 434 |
| Total Asia Pacific - Oil consumption (incl. China and Japan) | '000 barrels/day | 18,958 | 20,038 | 19,602 | 20,535 | 21,114 | 21,263 | 21,898 | 22,674 | 23,905 | 24,294 | 24,589 |
| Asia Pacific oil consumption - Others | '000 barrels/day | 3,262 | 3,526 | 3,511 | 3,659 | 3,987 | 4,049 | 4,360 | 4,603 | 4,992 | 4,928 | 5,052 |
(5) When graphed, the unit of oil production and consumption in million tonnes is shown as Mtoe (million tonnes oil equivalent) to enable charting that combines different sources of primary energy.
(6) Inland demand plus international aviation and marine bunkers and refinery fuel and loss. Fuel ethanol and biodiesel consumption are also included.
© 1995-2007 BP p.l.c | Legal Notice