
skip navigation
- BP - Environmental data 2006
- Total air emissions: By pollutant
- Total air emissions: By segment
- Air emissions, by pollutant: Methane
- Air emissions, by pollutant: NMHC
- Air emissions, by pollutant: Sulphur Dioxide
- Air emissions, by pollutant: Oxides of Nitrogen
- Air emissions, by business segment: E&P
- Air emissions, by business segment: R&M
- Air emissions, by business segment: Chemicals
- Air emissions, by business segment: - GRST and Other
- Total discharges to water: By business segment
- Total discharges to water: By pollutant, E&P
- Total discharges to water: By pollutant, COD
- Total water withdrawal: Group
- Total hazardous waste: By business segment
BP - Environmental data 2006
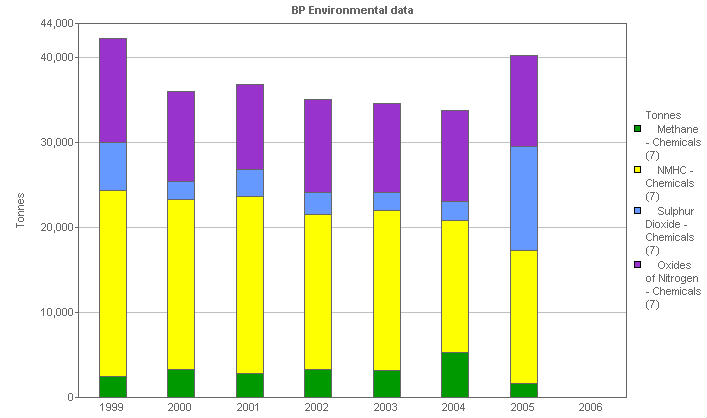
Air emissions, by business segment: Chemicals
This stacked bar chart shows the emissions to air of the Chemicals business segment, analyzed by pollutant type.
| Units | 1999 | 2000 | 2001 | 2002 | 2003 | 2004 | 2005 | 2006 | |
|---|---|---|---|---|---|---|---|---|---|
| Emissions to Air - Group total (9) | Tonnes | 1,354,596 | 1,211,171 | 1,222,918 | 1,036,207 | 886,462 | 844,431 | 903,268 | 763,675 |
| Total Emissions to Air - Chemicals (7,9) | Tonnes | 42,234 | 36,047 | 36,776 | 35,065 | 34,568 | 33,722 | 40,274 | |
| Methane - Chemicals (7) | Tonnes | 2,516 | 3,269 | 2,837 | 3,283 | 3,183 | 5,295 | 1,591 | |
| NMHC - Chemicals (7) | Tonnes | 21,801 | 20,017 | 20,767 | 18,198 | 18,826 | 15,552 | 15,735 | |
| Sulphur Dioxide - Chemicals (7) | Tonnes | 5,709 | 2,126 | 3,175 | 2,688 | 2,072 | 2,265 | 12,249 | |
| Oxides of Nitrogen - Chemicals (7) | Tonnes | 12,208 | 10,635 | 9,997 | 10,896 | 10,487 | 10,610 | 10,699 |
(7) Chemicals business in 2005 is the Innovene business sold as Ineos
© 1995-2007 BP p.l.c | Legal Notice