
skip navigation
- BP - Environmental data 2006
- Total air emissions: By pollutant
- Total air emissions: By segment
- Air emissions, by pollutant: Methane
- Air emissions, by pollutant: NMHC
- Air emissions, by pollutant: Sulphur Dioxide
- Air emissions, by pollutant: Oxides of Nitrogen
- Air emissions, by business segment: E&P
- Air emissions, by business segment: R&M
- Air emissions, by business segment: Chemicals
- Air emissions, by business segment: - GRST and Other
- Total discharges to water: By business segment
- Total discharges to water: By pollutant, E&P
- Total discharges to water: By pollutant, COD
- Total water withdrawal: Group
- Total hazardous waste: By business segment
BP - Environmental data 2006
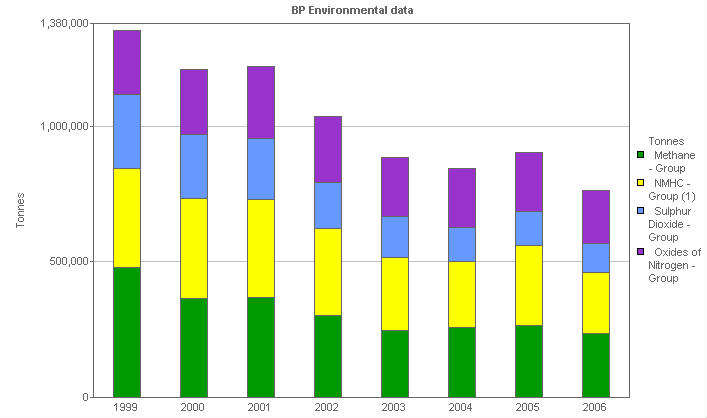
Total air emissions: By pollutant
This stacked bar chart shows total emissions to air, analyzed by pollutant type.
| Units | 1999 | 2000 | 2001 | 2002 | 2003 | 2004 | 2005 | 2006 | |
|---|---|---|---|---|---|---|---|---|---|
| Emissions to Air - Group total (9) | Tonnes | 1,354,596 | 1,211,171 | 1,222,918 | 1,036,207 | 886,462 | 844,431 | 903,268 | 763,675 |
| Methane - Group | Tonnes | 478,796 | 366,637 | 367,201 | 302,764 | 246,464 | 257,527 | 263,840 | 236,147 |
| NMHC - Group (1) | Tonnes | 365,299 | 367,960 | 365,043 | 322,119 | 268,785 | 245,078 | 297,838 | 225,420 |
| Sulphur Dioxide - Group | Tonnes | 272,958 | 234,689 | 224,541 | 169,236 | 150,895 | 126,364 | 123,655 | 106,114 |
| Oxides of Nitrogen - Group | Tonnes | 237,544 | 241,885 | 266,133 | 242,088 | 220,318 | 215,462 | 217,935 | 195,994 |
(1) NMHC - Non-Methane Hydrocarbons
© 1995-2007 BP p.l.c | Legal Notice