
skip navigation
- BP - Environmental data 2006
- Total air emissions: By pollutant
- Total air emissions: By segment
- Air emissions, by pollutant: Methane
- Air emissions, by pollutant: NMHC
- Air emissions, by pollutant: Sulphur Dioxide
- Air emissions, by pollutant: Oxides of Nitrogen
- Air emissions, by business segment: E&P
- Air emissions, by business segment: R&M
- Air emissions, by business segment: Chemicals
- Air emissions, by business segment: - GRST and Other
- Total discharges to water: By business segment
- Total discharges to water: By pollutant, E&P
- Total discharges to water: By pollutant, COD
- Total water withdrawal: Group
- Total hazardous waste: By business segment
BP - Environmental data 2006
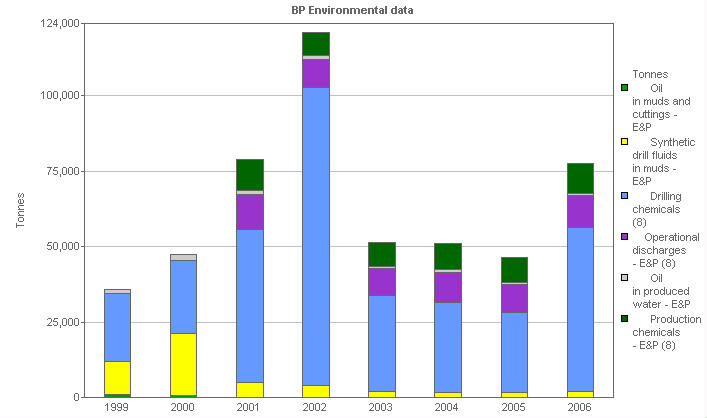
Total discharges to water: By pollutant, E&P
This stacked bar chart shows the discharges to water of the Exploration and Production business segment, analyzed by pollutant type.
| Units | 1999 | 2000 | 2001 | 2002 | 2003 | 2004 | 2005 | 2006 | |
|---|---|---|---|---|---|---|---|---|---|
| Discharges to water - Group total | Tonnes | 46,381 | 58,399 | 80,918 | 125,872 | 57,067 | 56,981 | 45,883 | 71,322 |
| Drilling discharges E&P (8) | Tonnes | 34,353 | 45,499 | 55,595 | 102,820 | 33,928 | 31,652 | 28,233 | 56,320 |
| Oil in muds and cuttings - E&P | Tonnes | 1,031 | 705 | 0 | 0 | 0 | 0 | 0 | 0 |
| Synthetic drill fluids in muds - E&P | Tonnes | 10,984 | 20,570 | 5,067 | 4,032 | 2,096 | 1,561 | 1,552 | 1,968 |
| Drilling chemicals (8) | Tonnes | 22,338 | 24,224 | 50,528 | 98,788 | 31,832 | 30,091 | 26,681 | 54,352 |
| Operational discharges - E&P (8) | Tonnes | 11,653 | 9,081 | 8,681 | 9,733 | 9,119 | 10,623 | ||
| Oil in produced water - E&P | Tonnes | 1,420 | 2,016 | 1,390 | 1,359 | 832 | 939 | 768 | 605 |
| Production chemicals - E&P (8) | Tonnes | 10,263 | 7,722 | 7,849 | 8,794 | 8,351 | 10,018 |
(8) New water categories reported for the first time in the charting tool in 2005
© 1995-2007 BP p.l.c | Legal Notice