
skip navigation
- BP - Environmental data 2006
- Total air emissions: By pollutant
- Total air emissions: By segment
- Air emissions, by pollutant: Methane
- Air emissions, by pollutant: NMHC
- Air emissions, by pollutant: Sulphur Dioxide
- Air emissions, by pollutant: Oxides of Nitrogen
- Air emissions, by business segment: E&P
- Air emissions, by business segment: R&M
- Air emissions, by business segment: Chemicals
- Air emissions, by business segment: - GRST and Other
- Total discharges to water: By business segment
- Total discharges to water: By pollutant, E&P
- Total discharges to water: By pollutant, COD
- Total water withdrawal: Group
- Total hazardous waste: By business segment
BP - Environmental data 2006
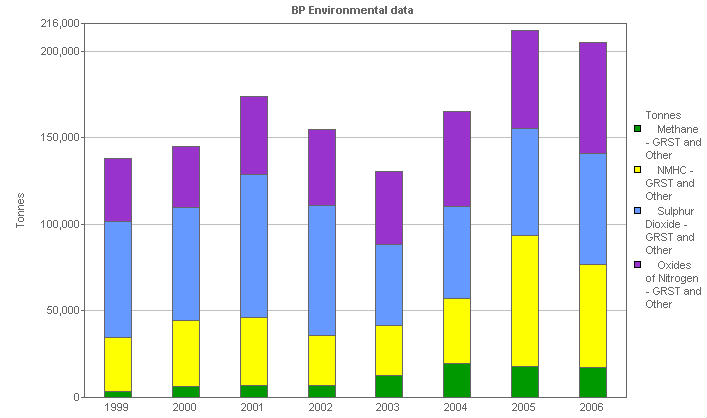
Air emissions, by business segment: - GRST and Other
This stacked bar chart shows the emissions to air of the GRST and Other business segment, analyzed by pollutant type. 'Other' businesses includes aluminum and BP corporate functions/offices, from 2005 this includes SECCO, PEMBS and Pasadena. Prior to 2005 'Other' included Gas, Power and Renewables.
| Units | 1999 | 2000 | 2001 | 2002 | 2003 | 2004 | 2005 | 2006 | |
|---|---|---|---|---|---|---|---|---|---|
| Emissions to Air - Group total (9) | Tonnes | 1,354,596 | 1,211,171 | 1,222,918 | 1,036,207 | 886,462 | 844,431 | 903,268 | 763,675 |
| Total Emissions to Air - GRST and Other (3,9) | Tonnes | 138,273 | 144,691 | 173,742 | 154,634 | 130,308 | 165,394 | 211,987 | 205,189 |
| Methane - GRST and Other | Tonnes | 3,436 | 6,276 | 6,783 | 6,941 | 12,454 | 19,880 | 17,812 | 17,462 |
| NMHC - GRST and Other | Tonnes | 31,204 | 38,226 | 39,458 | 28,814 | 29,135 | 37,322 | 75,886 | 59,092 |
| Sulphur Dioxide - GRST and Other | Tonnes | 67,175 | 65,515 | 82,283 | 75,086 | 46,721 | 53,099 | 61,770 | 64,320 |
| Oxides of Nitrogen - GRST and Other | Tonnes | 36,458 | 34,674 | 45,218 | 43,793 | 41,998 | 55,093 | 56,519 | 64,315 |
© 1995-2007 BP p.l.c | Legal Notice