
skip navigation
- BP - Environmental data 2006
- Total air emissions: By pollutant
- Total air emissions: By segment
- Air emissions, by pollutant: Methane
- Air emissions, by pollutant: NMHC
- Air emissions, by pollutant: Sulphur Dioxide
- Air emissions, by pollutant: Oxides of Nitrogen
- Air emissions, by business segment: E&P
- Air emissions, by business segment: R&M
- Air emissions, by business segment: Chemicals
- Air emissions, by business segment: - GRST and Other
- Total discharges to water: By business segment
- Total discharges to water: By pollutant, E&P
- Total discharges to water: By pollutant, COD
- Total water withdrawal: Group
- Total hazardous waste: By business segment
BP - Environmental data 2006
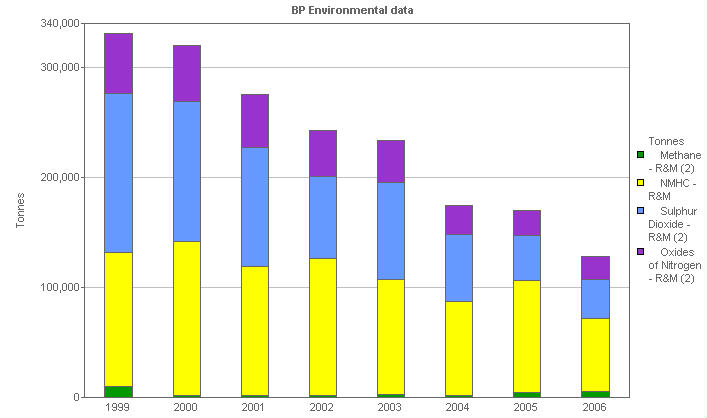
Air emissions, by business segment: R&M
This stacked bar chart shows the emissions to air of the Refining and Marketing business segment, analyzed by pollutant type.
| Units | 1999 | 2000 | 2001 | 2002 | 2003 | 2004 | 2005 | 2006 | |
|---|---|---|---|---|---|---|---|---|---|
| Emissions to Air - Group total (9) | Tonnes | 1,354,596 | 1,211,171 | 1,222,918 | 1,036,207 | 886,462 | 844,431 | 903,268 | 763,675 |
| Total Emissions to Air - R&M (2,9) | Tonnes | 331,099 | 319,816 | 275,718 | 243,127 | 233,223 | 174,185 | 170,076 | 128,562 |
| Methane - R&M (2) | Tonnes | 10,126 | 1,716 | 1,478 | 1,375 | 2,327 | 1,681 | 4,973 | 5,333 |
| NMHC - R&M | Tonnes | 121,664 | 139,730 | 117,952 | 125,247 | 104,492 | 85,539 | 101,499 | 66,285 |
| Sulphur Dioxide - R&M (2) | Tonnes | 144,608 | 127,337 | 107,978 | 74,544 | 88,521 | 60,595 | 40,652 | 35,656 |
| Oxides of Nitrogen - R&M (2) | Tonnes | 54,700 | 51,032 | 48,310 | 41,961 | 37,883 | 26,370 | 22,952 | 21,288 |
(2) From 2003, air emissions for marketing have excluded SOx and NOx
© 1995-2007 BP p.l.c | Legal Notice