
skip navigation
- BP - Environmental data 2006
- Total air emissions: By pollutant
- Total air emissions: By segment
- Air emissions, by pollutant: Methane
- Air emissions, by pollutant: NMHC
- Air emissions, by pollutant: Sulphur Dioxide
- Air emissions, by pollutant: Oxides of Nitrogen
- Air emissions, by business segment: E&P
- Air emissions, by business segment: R&M
- Air emissions, by business segment: Chemicals
- Air emissions, by business segment: - GRST and Other
- Total discharges to water: By business segment
- Total discharges to water: By pollutant, E&P
- Total discharges to water: By pollutant, COD
- Total water withdrawal: Group
- Total hazardous waste: By business segment
BP - Environmental data 2006
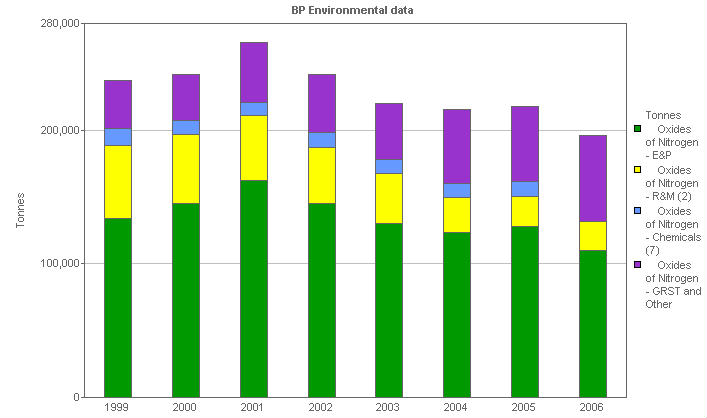
Air emissions, by pollutant: Oxides of Nitrogen
This stacked bar chart shows the oxides of nitrogen emissions to air of each business segment.
| Units | 1999 | 2000 | 2001 | 2002 | 2003 | 2004 | 2005 | 2006 | |
|---|---|---|---|---|---|---|---|---|---|
| Emissions to Air - Group total (9) | Tonnes | 1,354,596 | 1,211,171 | 1,222,918 | 1,036,207 | 886,462 | 844,431 | 903,268 | 763,675 |
| Total Emissions to Air - E&P (9) | Tonnes | 842,990 | 710,617 | 736,682 | 603,381 | 488,363 | 471,130 | 480,930 | 429,924 |
| Oxides of Nitrogen - E&P | Tonnes | 134,177 | 145,544 | 162,608 | 145,438 | 129,950 | 123,389 | 127,765 | 110,391 |
| Total Emissions to Air - R&M (2,9) | Tonnes | 331,099 | 319,816 | 275,718 | 243,127 | 233,223 | 174,185 | 170,076 | 128,562 |
| Oxides of Nitrogen - R&M (2) | Tonnes | 54,700 | 51,032 | 48,310 | 41,961 | 37,883 | 26,370 | 22,952 | 21,288 |
| Total Emissions to Air - Chemicals (7,9) | Tonnes | 42,234 | 36,047 | 36,776 | 35,065 | 34,568 | 33,722 | 40,274 | |
| Oxides of Nitrogen - Chemicals (7) | Tonnes | 12,208 | 10,635 | 9,997 | 10,896 | 10,487 | 10,610 | 10,699 | |
| Total Emissions to Air - GRST and Other (3,9) | Tonnes | 138,273 | 144,691 | 173,742 | 154,634 | 130,308 | 165,394 | 211,987 | 205,189 |
| Oxides of Nitrogen - GRST and Other | Tonnes | 36,458 | 34,674 | 45,218 | 43,793 | 41,998 | 55,093 | 56,519 | 64,315 |
(2) From 2003, air emissions for marketing have excluded SOx and NOx
(7) Chemicals business in 2005 is the Innovene business sold as Ineos
© 1995-2007 BP p.l.c | Legal Notice