
skip navigation
- BP - Environmental data 2006
- Total air emissions: By pollutant
- Total air emissions: By segment
- Air emissions, by pollutant: Methane
- Air emissions, by pollutant: NMHC
- Air emissions, by pollutant: Sulphur Dioxide
- Air emissions, by pollutant: Oxides of Nitrogen
- Air emissions, by business segment: E&P
- Air emissions, by business segment: R&M
- Air emissions, by business segment: Chemicals
- Air emissions, by business segment: - GRST and Other
- Total discharges to water: By business segment
- Total discharges to water: By pollutant, E&P
- Total discharges to water: By pollutant, COD
- Total water withdrawal: Group
- Total hazardous waste: By business segment
BP - Environmental data 2006
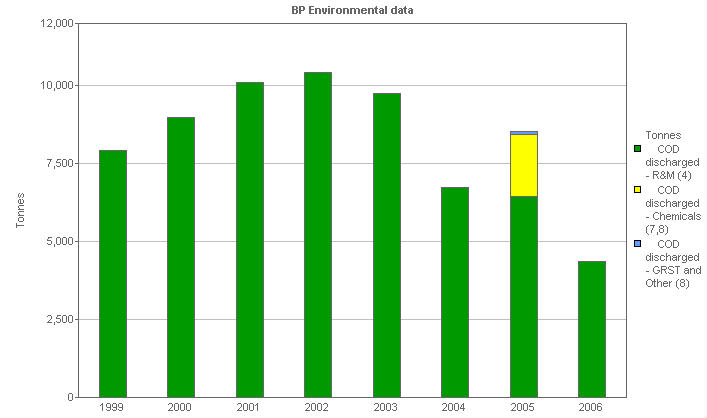
Total discharges to water: By pollutant, COD
This stacked bar chart shows the discharges to water of the Chemical Oxygen Demand business segment, analyzed by pollutant type.
| Units | 1999 | 2000 | 2001 | 2002 | 2003 | 2004 | 2005 | 2006 | |
|---|---|---|---|---|---|---|---|---|---|
| Discharges to water - Group total | Tonnes | 46,381 | 58,399 | 80,918 | 125,872 | 57,067 | 56,981 | 45,883 | 71,322 |
| Discharges to water - R&M (5) | Tonnes | 2,449 | 2,812 | 2,963 | 4,935 | 5,085 | 7,949 | 6,453 | 4,376 |
| COD discharged - R&M (4) | Tonnes | 7,911 | 8,973 | 10,107 | 10,430 | 9,738 | 6,728 | 6,453 | 4,376 |
| Discharges to water - Chemicals (7) | Tonnes | 8,088 | 8,071 | 10,708 | 9,036 | 9,376 | 7,647 | 1,977 | |
| COD discharged - Chemicals (7,8) | Tonnes | 1,977 | |||||||
| Discharges to water - GRST and Other (3,8) | Tonnes | 101 | 3 | ||||||
| COD discharged - GRST and Other (8) | Tonnes | 101 | 3 |
(8) New water categories reported for the first time in the charting tool in 2005
© 1995-2007 BP p.l.c | Legal Notice