
skip navigation
- BP - Environmental data 2006
- Total air emissions: By pollutant
- Total air emissions: By segment
- Air emissions, by pollutant: Methane
- Air emissions, by pollutant: NMHC
- Air emissions, by pollutant: Sulphur Dioxide
- Air emissions, by pollutant: Oxides of Nitrogen
- Air emissions, by business segment: E&P
- Air emissions, by business segment: R&M
- Air emissions, by business segment: Chemicals
- Air emissions, by business segment: - GRST and Other
- Total discharges to water: By business segment
- Total discharges to water: By pollutant, E&P
- Total discharges to water: By pollutant, COD
- Total water withdrawal: Group
- Total hazardous waste: By business segment
BP - Environmental data 2006
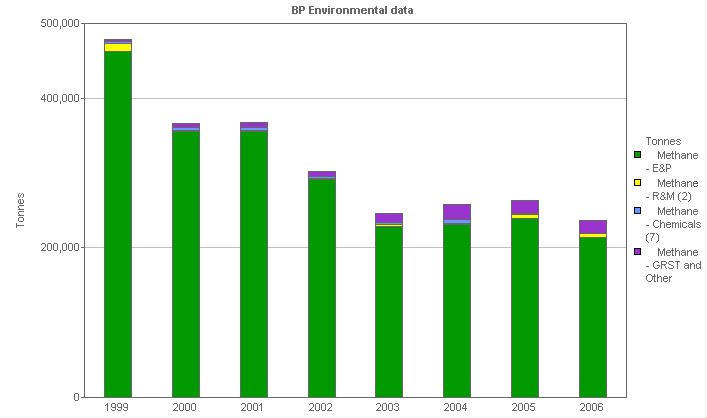
Air emissions, by pollutant: Methane
This stacked bar chart shows the methane emissions to air of each business segment.
| Units | 1999 | 2000 | 2001 | 2002 | 2003 | 2004 | 2005 | 2006 | |
|---|---|---|---|---|---|---|---|---|---|
| Emissions to Air - Group total (9) | Tonnes | 1,354,596 | 1,211,171 | 1,222,918 | 1,036,207 | 886,462 | 844,431 | 903,268 | 763,675 |
| Total Emissions to Air - E&P (9) | Tonnes | 842,990 | 710,617 | 736,682 | 603,381 | 488,363 | 471,130 | 480,930 | 429,924 |
| Methane - E&P | Tonnes | 462,718 | 355,376 | 356,103 | 291,165 | 228,500 | 230,671 | 239,463 | 213,352 |
| Total Emissions to Air - R&M (2,9) | Tonnes | 331,099 | 319,816 | 275,718 | 243,127 | 233,223 | 174,185 | 170,076 | 128,562 |
| Methane - R&M (2) | Tonnes | 10,126 | 1,716 | 1,478 | 1,375 | 2,327 | 1,681 | 4,973 | 5,333 |
| Total Emissions to Air - Chemicals (7,9) | Tonnes | 42,234 | 36,047 | 36,776 | 35,065 | 34,568 | 33,722 | 40,274 | |
| Methane - Chemicals (7) | Tonnes | 2,516 | 3,269 | 2,837 | 3,283 | 3,183 | 5,295 | 1,591 | |
| Total Emissions to Air - GRST and Other (3,9) | Tonnes | 138,273 | 144,691 | 173,742 | 154,634 | 130,308 | 165,394 | 211,987 | 205,189 |
| Methane - GRST and Other | Tonnes | 3,436 | 6,276 | 6,783 | 6,941 | 12,454 | 19,880 | 17,812 | 17,462 |
(2)From 2003, air emissions for marketing have excluded SOx and NOx
(7) Chemicals business in 2005 is the Innovene business sold as Ineos
© 1995-2007 BP p.l.c | Legal Notice