
skip navigation
- BP - Environmental data 2006
- Total air emissions: By pollutant
- Total air emissions: By segment
- Air emissions, by pollutant: Methane
- Air emissions, by pollutant: NMHC
- Air emissions, by pollutant: Sulphur Dioxide
- Air emissions, by pollutant: Oxides of Nitrogen
- Air emissions, by business segment: E&P
- Air emissions, by business segment: R&M
- Air emissions, by business segment: Chemicals
- Air emissions, by business segment: - GRST and Other
- Total discharges to water: By business segment
- Total discharges to water: By pollutant, E&P
- Total discharges to water: By pollutant, COD
- Total water withdrawal: Group
- Total hazardous waste: By business segment
BP - Environmental data 2006
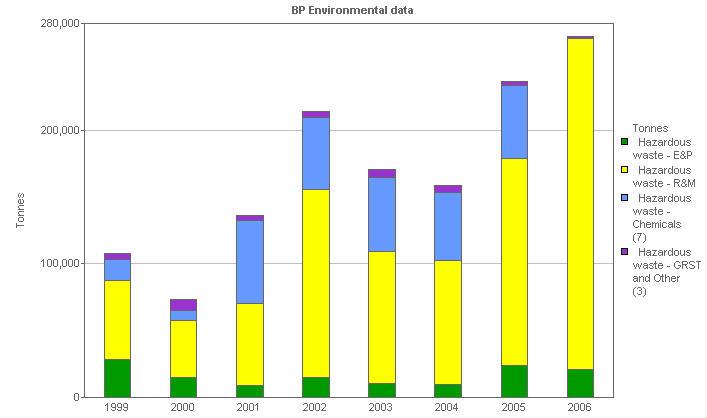
Total hazardous waste: By business segment
This stacked bar chart shows the total hazardous waste, analyzed by business segment.
| Units | 1999 | 2000 | 2001 | 2002 | 2003 | 2004 | 2005 | 2006 | |
|---|---|---|---|---|---|---|---|---|---|
| Hazardous waste - Group (6) | Tonnes | 108,050 | 73,325 | 135,984 | 214,487 | 170,756 | 158,551 | 236,799 | 270,325 |
| Hazardous waste - E&P | Tonnes | 28,426 | 14,607 | 8,890 | 14,811 | 10,594 | 9,817 | 24,196 | 21,204 |
| Hazardous waste - R&M | Tonnes | 59,095 | 43,230 | 61,413 | 141,018 | 98,345 | 92,413 | 154,503 | 247,905 |
| Hazardous waste - Chemicals (7) | Tonnes | 15,502 | 7,520 | 62,027 | 53,869 | 55,944 | 51,374 | 55,034 | |
| Hazardous waste - GRST and Other (3) | Tonnes | 5,027 | 7,968 | 3,654 | 4,789 | 5,873 | 4,947 | 3,067 | 1,216 |
(3) 'Other' businesses includes aluminum and BP corporate functions/offices. In 2005 Wingles, SECCO, PEMSB and Pasadena which were previously part of Chemicals were included in 'Other' businesses. From 2006 SECCO and PEMSB are included with Refinery and Marketing.
(7) Chemicals business in 2005 is the Innovene business sold as Ineos
(8) New water categories reported for the first time in the charting tool in 2005
© 1995-2007 BP p.l.c | Legal Notice