
skip navigation
- BP - Environmental data 2006
- Total air emissions: By pollutant
- Total air emissions: By segment
- Air emissions, by pollutant: Methane
- Air emissions, by pollutant: NMHC
- Air emissions, by pollutant: Sulphur Dioxide
- Air emissions, by pollutant: Oxides of Nitrogen
- Air emissions, by business segment: E&P
- Air emissions, by business segment: R&M
- Air emissions, by business segment: Chemicals
- Air emissions, by business segment: - GRST and Other
- Total discharges to water: By business segment
- Total discharges to water: By pollutant, E&P
- Total discharges to water: By pollutant, COD
- Total water withdrawal: Group
- Total hazardous waste: By business segment
BP - Environmental data 2006
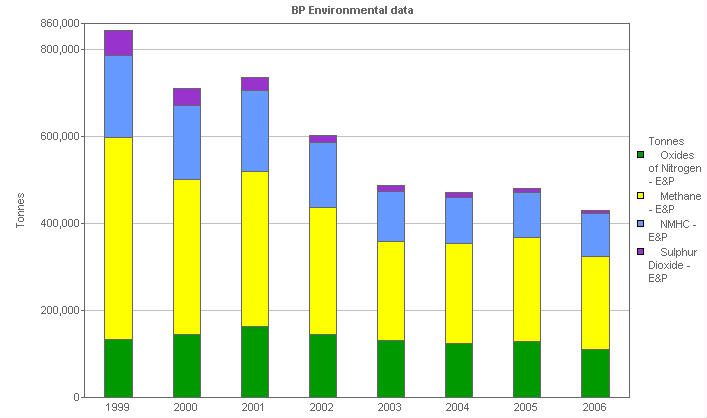
Air emissions, by business segment: E&P
This stacked bar chart shows the emissions to air of the Exploration and Production business segment, analyzed by pollutant type.
| Units | 1999 | 2000 | 2001 | 2002 | 2003 | 2004 | 2005 | 2006 | |
|---|---|---|---|---|---|---|---|---|---|
| Emissions to Air - Group total (9) | Tonnes | 1,354,596 | 1,211,171 | 1,222,918 | 1,036,207 | 886,462 | 844,431 | 903,268 | 763,675 |
| Total Emissions to Air - E&P (9) | Tonnes | 842,990 | 710,617 | 736,682 | 603,381 | 488,363 | 471,130 | 480,930 | 429,924 |
| Methane - E&P | Tonnes | 462,718 | 355,376 | 356,103 | 291,165 | 228,500 | 230,671 | 239,463 | 213,352 |
| NMHC - E&P | Tonnes | 190,629 | 169,986 | 186,866 | 149,860 | 116,332 | 106,665 | 104,718 | 100,043 |
| Sulphur Dioxide - E&P | Tonnes | 55,465 | 39,711 | 31,105 | 16,918 | 13,581 | 10,405 | 8,984 | 6,138 |
| Oxides of Nitrogen - E&P | Tonnes | 134,177 | 145,544 | 162,608 | 145,438 | 129,950 | 123,389 | 127,765 | 110,391 |
© 1995-2007 BP p.l.c | Legal Notice