
skip navigation
- BP - Environmental data 2006
- Total air emissions: By pollutant
- Total air emissions: By segment
- Air emissions, by pollutant: Methane
- Air emissions, by pollutant: NMHC
- Air emissions, by pollutant: Sulphur Dioxide
- Air emissions, by pollutant: Oxides of Nitrogen
- Air emissions, by business segment: E&P
- Air emissions, by business segment: R&M
- Air emissions, by business segment: Chemicals
- Air emissions, by business segment: - GRST and Other
- Total discharges to water: By business segment
- Total discharges to water: By pollutant, E&P
- Total discharges to water: By pollutant, COD
- Total water withdrawal: Group
- Total hazardous waste: By business segment
BP - Environmental data 2006
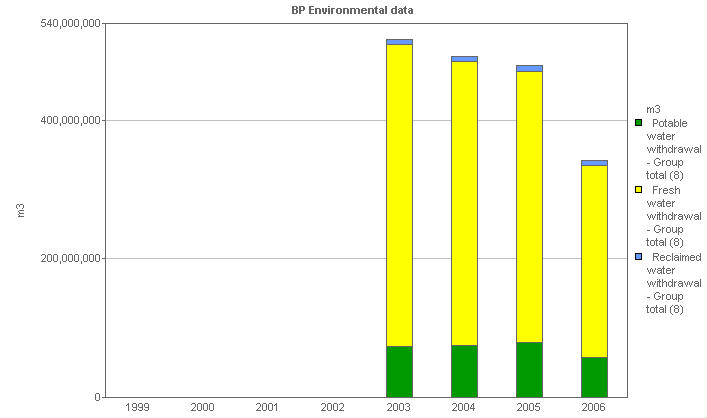
Total water withdrawal: Group
This stacked bar chart shows the total water withdrawal for the Group
| Units | 1999 | 2000 | 2001 | 2002 | 2003 | 2004 | 2005 | 2006 | |
|---|---|---|---|---|---|---|---|---|---|
| Total water withdrawal - Group total (8) | m3 | 516,872,770 | 492,949,227 | 478,724,386 | 341,754,668 | ||||
| Potable water withdrawal - Group total (8) | m3 | 73,510,195 | 75,464,350 | 80,101,565 | 57,917,724 | ||||
| Fresh water withdrawal - Group total (8) | m3 | 435,535,334 | 410,376,000 | 390,759,986 | 277,130,218 | ||||
| Reclaimed water withdrawal - Group total (8) | m3 | 7,827,241 | 7,108,877 | 7,862,835 | 6,706,726 |
(8) New water categories reported for the first time in the charting tool in 2005
© 1995-2007 BP p.l.c | Legal Notice