
BP - Annual data - homepage
RCPBIT: Total
RCPBIT: By business
Net cash provided by operating activities
Operating capital employed: By business
Operating capital employed: By geographical area
Capital expenditure: By business
Capital expenditure: By geographical area
Ratios: Debt ratios
Ratios: Return on average capital employed
Ratios: Dividend payout
Dividends: Per ordinary share (pence)
Dividends: Per ordinary share (cents)
Dividends: Per ADS
BP performance versus comparatives: E&P versus Brent Oil
BP performance versus comparatives: E&P versus BP average oil realizations
BP performance versus comparatives: R&M versus indicator margin
BP performance versus comparatives: Gas versus Oil production
BP performance versus comparatives: Finding and development costs
BP performance versus comparatives: Lifting costs
BP performance versus comparatives: Cost of supply
BP performance versus comparatives: Net income per boe
BP performance versus comparatives: Reserves replacement
|
|
|
BP - Annual data 2000-2004
|
|
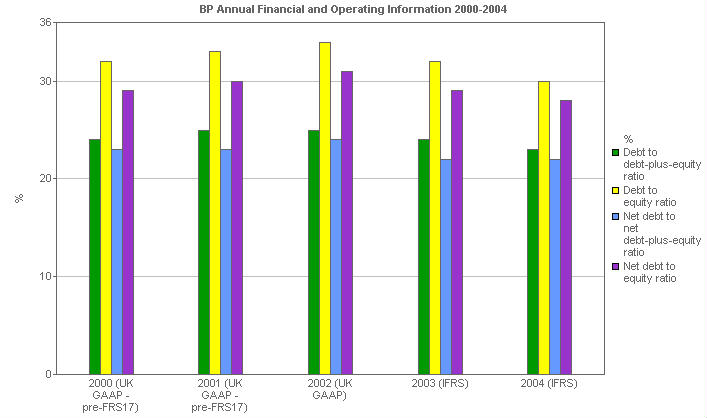
Ratios: Debt ratios
This clustered bar chart compares the following debt ratios (all reported basis): debt to debt-plus-equity ratio; debt to equity ratio; net debt to net debt-plus-equity ratio; net debt to equity ratio.
|
|
 |
|
|
|
Units
|
2000
(UK GAAP -
pre-FRS17)
|
2001
(UK GAAP -
pre-FRS17)
|
2002
(UK GAAP)
|
2003
(IFRS)
|
2004
(IFRS)
|
|
Ratios - Replacement cost basis
|
|
|
|
|
|
|
|
Debt to debt-plus-equity ratio
|
%
|
24
|
25
|
25
|
24
|
23
|
|
Debt to equity ratio
|
%
|
32
|
33
|
34
|
32
|
30
|
|
Net debt to net debt-plus-equity ratio
|
%
|
23
|
23
|
24
|
22
|
22
|
|
Net debt to equity ratio
|
%
|
29
|
30
|
31
|
29
|
28
|
The financial information for 2003 and 2004 has been restated to reflect the adoption of IFRS. The financial information for 2000 to 2002 has not been restated for IFRS and remains on the basis of UK GAAP. UK GAAP information for 2002 reflects the adoption by the group of Financial Reporting Standard No. 17 'Retirement Benefits' (FRS 17) with effect from 1 January 2004. Financial information for 2000 and 2001 has not been restated for FRS 17.
Debt to debt-plus-equity ratio
The ratio of finance debt (borrowings plus obligations under finance leases) to the total of finance debt plus shareholders interest.
Debt to equity ratio
The ratio of finance debt (borrowings plus obligations under finance leases) to shareholders interest.
Net debt
Net debt equals finance debt less cash and cash equivalents.
|
|
