 |
BP - Annual data 2000-2004
|
|
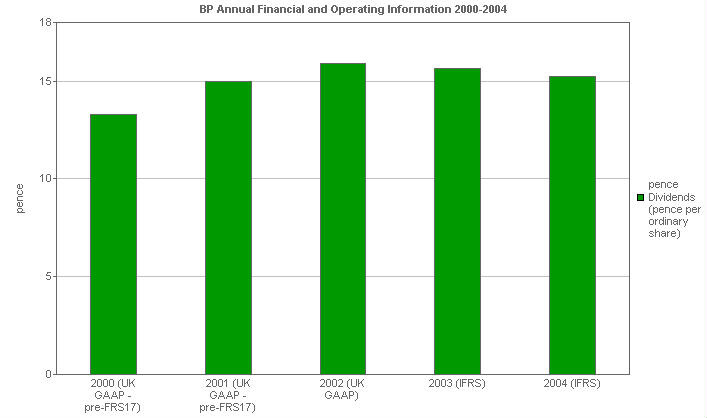
Dividends: Per ordinary share (pence)
This bar chart shows dividends paid per ordinary share (pence per ordinary share).
|
|
 |
|
|
|
Units
|
2000
(UK GAAP -
pre-FRS17)
|
2001
(UK GAAP -
pre-FRS17)
|
2002
(UK GAAP)
|
2003
(IFRS)
|
2004
(IFRS)
|
|
Dividends (annual paid)
|
|
|
|
|
|
|
|
Dividends (pence per ordinary share)
|
pence
|
13.299
|
14.998
|
15.878
|
15.658
|
15.251
|
Under IFRS dividends are shown on a when "paid" rather than when "declared" basis and as such all the dividends are now shown on this basis.
|
