|
|
Units
|
2000
(UK GAAP -
pre-FRS17)
|
2001
(UK GAAP -
pre-FRS17)
|
2002
(UK GAAP)
|
2003
(IFRS)
|
2004
(IFRS)
|
|
E&P - comparatives & statistics
|
|
|
|
|
|
|
|
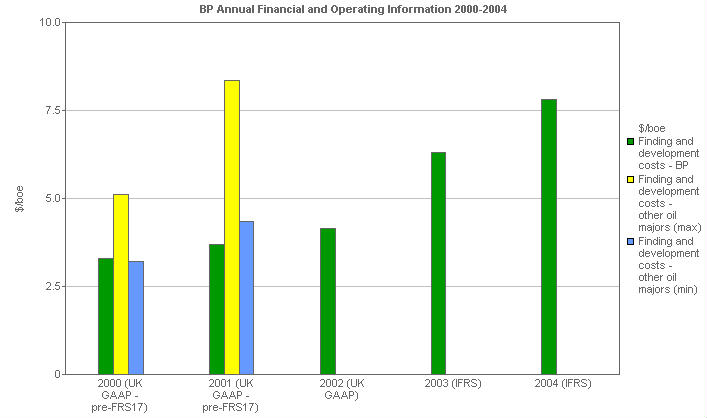
Finding and development costs
|
|
|
|
|
|
|
|
Finding and development costs - BP
|
$/boe
|
3.29
|
3.68
|
4.14
|
6.30
|
7.81
|
|
Finding and development costs - other oil majors (max)
|
$/boe
|
5.11
|
8.34
|
|
|
|
|
Finding and development costs - other oil majors (min)
|
$/boe
|
3.21
|
4.34
|
|
|
|