
BP - Annual data - homepage
RCPBIT: Total
RCPBIT: By business
Net cash provided by operating activities
Operating capital employed: By business
Operating capital employed: By geographical area
Capital expenditure: By business
Capital expenditure: By geographical area
Ratios: Debt ratios
Ratios: Return on average capital employed
Ratios: Dividend payout
Dividends: Per ordinary share (pence)
Dividends: Per ordinary share (cents)
Dividends: Per ADS
BP performance versus comparatives: E&P versus Brent Oil
BP performance versus comparatives: E&P versus BP average oil realizations
BP performance versus comparatives: R&M versus indicator margin
BP performance versus comparatives: Gas versus Oil production
BP performance versus comparatives: Finding and development costs
BP performance versus comparatives: Lifting costs
BP performance versus comparatives: Cost of supply
BP performance versus comparatives: Net income per boe
BP performance versus comparatives: Reserves replacement
|
|
|
BP - Annual data 2000-2004
|
|
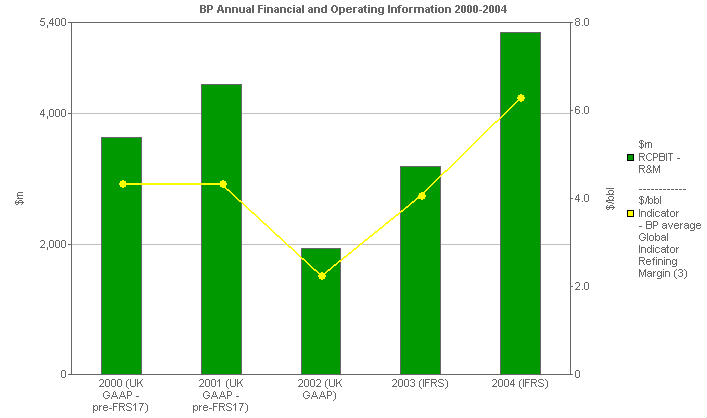
BP performance versus comparatives: R&M versus indicator margin
This chart shows replacement cost profit before interest and tax of the Refining and Marketing business segment (bar format, left hand scale), compared with the BP average Global Indicator Refining Margin (line format, right hand scale).
|
|
 |
|
|
|
Units
|
2000
(UK GAAP -
pre-FRS17)
|
2001
(UK GAAP -
pre-FRS17)
|
2002
(UK GAAP)
|
2003
(IFRS)
|
2004
(IFRS)
|
|
Replacement cost profit before interest and tax (1,2) - Total
|
$m
|
17,899
|
16,562
|
11,200
|
18,712
|
23,389
|
|
RCPBIT - by business
|
|
|
|
|
|
|
|
RCPBIT - R&M
|
$m
|
3,642
|
4,454
|
1,936
|
3,192
|
5,240
|
|
Indicator - BP average Global lndicator Refining Margin (3)
|
$/bbl
|
4.35
|
4.36
|
2.27
|
4.08
|
6.31
|
The financial information for 2003 and 2004 has been restated to reflect the adoption of IFRS. The financial information for 2000 to 2002 has not been restated for IFRS and remains on the basis of UK GAAP. UK GAAP information for 2002 reflects the adoption by the group of Financial Reporting Standard No. 17 'Retirement Benefits' (FRS 17) with effect from 1 January 2004. Financial information for 2000 and 2001 has not been restated for FRS 17.
Resegmentation
The segmental financial and operating information in this book for 2000-2004 has been restated to reflect changes to the business segment boundaries as follows:
- Our petrochemicals operations have been divided between the Refining and Marketing segment and Other businesses and corporate. The Aromatics and Acetyls businesses and the petrochemicals assets that are integrated with our Gelsenkirchenrefinery in Germany are now part of Refining and Marketing. The Olefins and Derivatives business is now reported within Other businesses and corporate.This segment has also been restated to include the legacy historical results of other petrochemicals assets that have been divested during the period 2000-2004. We have also combined our Grangemouth and Lavéra refineries into the Olefins and Derivatives business to maintain current operating synergies. These changes have been made in connection with the establishment of our Olefins and Derivatives business as a stand-alone entity within BP, with a view towards its divestment at a later date.
- A small US operation, the Hobbs fractionator, which supplies petrochemicals feedstock, has been transferred from Gas, Power and Renewables to Olefins and Derivatives.
- The Mardi Gras pipeline system in the Gulf of Mexico has been transferred from Exploration and Production to Refining and Marketing.
(1) Replacement cost profit is before inventory holding gains and losses.
(2) Replacement cost profit before interest and tax under IFRS includes equity-accounted interest and tax.
(3) The Global Indicator Refining Margin (GIM) is the average of six regional indicator margins weighted for BP's crude refining capacity in each region. Each regional indicator margin is based on a single representative crude with product yields characteristic of the typical level of upgrading complexity. The regional indicator margins may not be representative of the margins achieved by BP in any period because of BP's particular refinery configurations and crude and product slate. The GIM data shown above excludes the Grangemouth and Lavéra refineries.
|
|
