 |
BP - Annual data 2000-2004
|
|
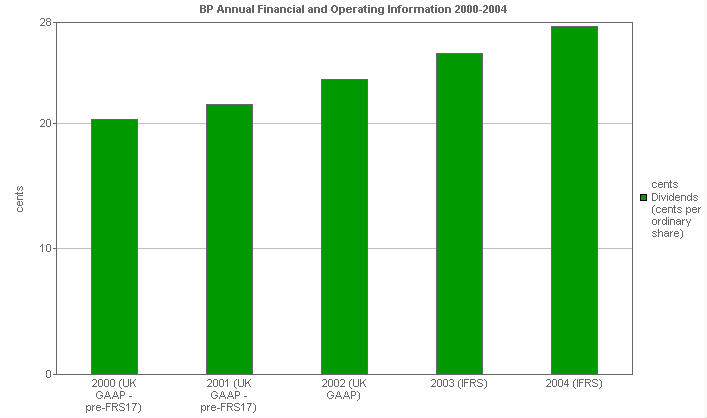
Dividends: Per ordinary share (cents)
This bar chart shows dividends paid per ordinary share (cents per ordinary share).
|
|
 |
|
|
|
Units
|
2000
(UK GAAP -
pre-FRS17)
|
2001
(UK GAAP -
pre-FRS17)
|
2002
(UK GAAP)
|
2003
(IFRS)
|
2004
(IFRS)
|
|
Dividends (annual paid)
|
|
|
|
|
|
|
|
Dividends (cents per ordinary share)
|
cents
|
20.25
|
21.50
|
23.50
|
25.50
|
27.70
|
Under IFRS dividends are shown on a when "paid" rather than when "declared" basis and as such all the dividends are now shown on this basis.
|
