|
|
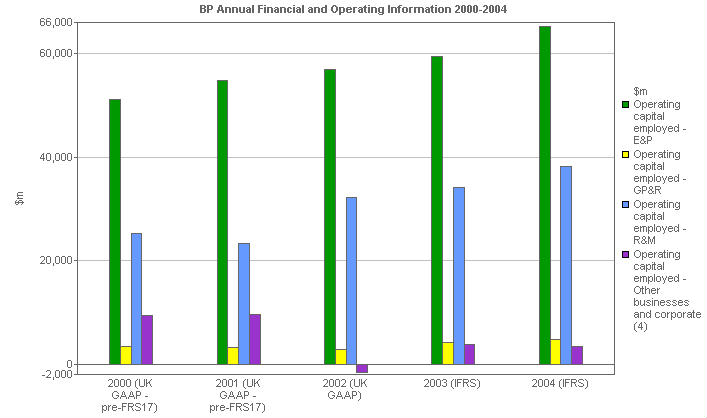
Units
|
2000
(UK GAAP -
pre-FRS17) |
2001
(UK GAAP -
pre-FRS17)
|
2002
(UK GAAP)
|
2003
(IFRS)
|
2004
(IFRS)
|
|
Capital employed
|
|
|
|
|
|
|
|
Operating capital employed - Total
|
$m
|
89,278
|
91,105
|
90,253
|
101,397
|
111,141
|
|
Operating capital employed - by business
|
|
|
|
|
|
|
|
Operating capital employed - E&P
|
$m
|
51,075
|
54,743
|
56,861
|
59,352
|
65,223
|
|
Operating capital employed - GP&R
|
$m
|
3,460
|
3,342
|
2,922
|
4,225
|
4,829
|
|
Operating capital employed - R&M
|
$m
|
25,196
|
23,399
|
32,166
|
34,251
|
38,262
|
|
Operating capital employed - Other businesses and corporate (4)
|
$m
|
9,547
|
9,621
|
(1,696)
|
3,930
|
3,379
|
The financial information for 2003 and 2004 has been restated to reflect the adoption of IFRS. The financial information for 2000 to 2002 has not been restated for IFRS and remains on the basis of UK GAAP. UK GAAP information for 2002 reflects the adoption by the group of Financial Reporting Standard No. 17 'Retirement Benefits' (FRS 17) with effect from 1 January 2004. Financial information for 2000 and 2001 has not been restated for FRS 17.
Resegmentation
The segmental financial and operating information in this book for 2000-2004 has been restated to reflect changes to the business segment boundaries as follows:
- Our petrochemicals operations have been divided between the Refining and Marketing segment and Other businesses and corporate. The Aromatics and Acetyls businesses and the petrochemicals assets that are integrated with our Gelsenkirchenrefinery in Germany are now part of Refining and Marketing. The Olefins and Derivatives business is now reported within Other businesses and corporate.This segment has also been restated to include the legacy historical results of other petrochemicals assets that have been divested during the period 2000-2004. We have also combined our Grangemouth and Lavéra refineries into the Olefins and Derivatives business to maintain current operating synergies. These changes have been made in connection with the establishment of our Olefins and Derivatives business as a stand-alone entity within BP, with a view towards its divestment at a later date.
- A small US operation, the Hobbs fractionator, which supplies petrochemicals feedstock, has been transferred from Gas, Power and Renewables to Olefins and Derivatives.
- The Mardi Gras pipeline system in the Gulf of Mexico has been transferred from Exploration and Production to Refining and Marketing.
(4) Other businesses and corporate comprises the Olefins and Derivatives business, Finance, the group's coal as
|