Total return
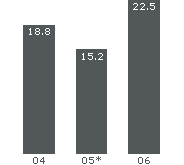
3i achieved a total return for the year to 31 March 2006 of £831 million, which equates to a 22.5% return on restated opening shareholders' funds (2005: 15.2%). A key feature of this return is the very strong level of realised profits on disposal of investments where, throughout the year, we have benefited from good market conditions for sales.
Table 1: Total return
| 2006 £m |
2005 (as restated)* £m |
|
|---|---|---|
| Realised profits on disposal of investments | 576 | 250 |
| Unrealised profits on revaluation of investments | 245 | 245 |
| Portfolio income | 232 | 232 |
| Gross portfolio return | 1,053 | 727 |
| Net carried interest | 15 | (64) |
| Fund management fees | 24 | 30 |
| Operating expenses | (211) | (177) |
| Net portfolio return | 881 | 516 |
| Net interest payable | (17) | (42) |
| Exchange movements | 47 | 13 |
| Movements in the fair value of derivatives | (78) | 13 |
| Other | 19 | (2) |
| Profit after tax | 852 | 498 |
| Reserve movements (pension, property and currency translation) | (21) | 3 |
| Total recognised income and expense (“Total return”) | 831 | 501 |
* As restated for the adoption of IFRS.
Total return comprises the total recognised income and expense as stated as a percentage of opening shareholders' funds.
Total return by year (%) to 31 March

* As restated for the adoption of IFRS.
As indicated in table 2, we have generated a very good level of gross portfolio return of £1,053 million (2005: £727 million), representing 24.4% on opening portfolio value (2005: 16.7%). Each of our core business lines has generated higher returns, with Venture Capital showing the most improved result over last year. Buyouts and Growth Capital are operating at the top end of their long-term target ranges, with returns of 29% and 26% respectively.
Table 2: Return by business line (£m)
| Buyouts | Growth Capital |
Venture Capital |
SMI | Total | ||||||
|---|---|---|---|---|---|---|---|---|---|---|
| 2006 |
2005 |
2006 |
2005 |
2006 |
2005 |
2006 |
2005 |
2006 |
2005 (as restated)* |
|
| Gross portfolio return | 447 | 301 | 341 | 285 | 128 | 76 | 137 | 65 | 1,053 | 727 |
| Return as % of opening portfolio | 29% | 20% | 26% | 23% | 17% | 11% | 18% | 7% | 24% | 17% |
| Net portfolio return | 881 | 516 | ||||||||
| Return as % of opening portfolio | 20% | 12% | ||||||||
| Total return | 831 | 501 | ||||||||
| Total return as % on opening shareholders' funds | 22% | 15% | ||||||||
* As restated for the adoption of IFRS.
The Group's gross portfolio return of 24% compares with 17% in 2005. After costs and carried interest, the net portfolio return is 20% (2005: 12%). The reduction of 4% from the gross level is below our anticipated range of 5% to 6%, as net carried interest benefited from significant carry receivable in the year.
Through gearing the balance sheet to an appropriate level, we would expect to enhance total return on opening shareholders' funds by some 4% from the net level. However, given the low level of gearing in our opening balance sheet, the benefit from leverage was below our long-term expectation.
![3i - Go to home page [Accesskey '0']](images/generic/logo.gif)
