Introduction
3i is a world leader in private equity and venture capital. We focus on buyouts, growth capital and venture capital and invest across Europe, the US and Asia.
Our competitive advantage comes from our international network and the strength and breadth of our relationships in business. These underpin the value that we deliver to our portfolio and to our shareholders.
Our purpose:
to provide quoted access to private equity returns.
Our vision:
to be the private equity firm of choice:
- operating on a world-wide scale;
- producing consistent market-beating returns;
- acknowledged for our partnership style; and
- winning through our unparalleled resources.
Our strategy:
- to invest in high-return assets;
- to grow our assets and those we manage on behalf of third parties;
- to extend our international reach, directly and through investing in funds;
- to use our balance sheet and resources to develop existing and new business lines; and
- to continue to build our strong culture of operating as one company across business lines, geographies and sectors.
This Annual report and accounts may contain certain statements about the future outlook for 3i. Although we believe our expectations are based on reasonable assumptions, any statements about the future outlook may be influenced by factors that could cause actual outcomes and results to be materially different.
Sections
Group financial highlights
Return on opening shareholders' funds
22.5%
Realisation proceeds
£2,207m
Total return
£831m
Dividend per share
15.2p
Financial highlights for the year to 31 March
| 2006 |
2005 (as restated)* |
|
|---|---|---|
| Gross portfolio return on opening portfolio value | 24.4% | 16.7% |
| Total return on opening shareholders' funds | 22.5% | 15.2% |
| Dividend per share† | 15.2p† | 14.6p |
| Realised profits over opening valuation on disposal of investments | £576m | £250m |
| Diluted net asset value per share | 739p | 614p |
| New investment | £1,110m | £755m |
| Realisation proceeds | £2,207m | £1,302m |
| Total portfolio value | £4,139m | £4,317m |
* Restated comparatives reflect the adoption of International Financial Reporting Standards ("IFRS").
†In addition, a special dividend of 40.7p per share was paid in the year.
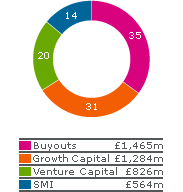
Portfolio value (%)
as at 31 March 2006

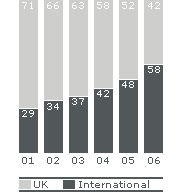
Trend in international portfolio value (%) as at 31 March

![3i - Go to home page [Accesskey '0']](images/generic/logo.gif)


