Venture Capital
"Operating as a single global team, sharing knowledge and experience, and working actively with our colleagues in other parts of the Group continues to provide 3i's Venture Capital business with significant competitive advantage. This advantage has supported a growth in returns, in new investment and, I believe, has helped to further strengthen our reputation and recognition in the key venture markets in Europe and the US."
Gross portfolio return
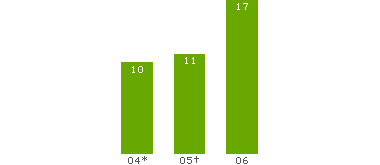
The Venture Capital business generated a gross portfolio return of 17% to 31 March 2006 (2005: 11%). This improvement in performance was driven by a number of factors, most importantly organisational changes made to integrate the team into a truly international partnership across Europe and the US and enhanced portfolio management disciplines.
As returns have improved in our Venture business, so has the amount of investment in late-stage technology increased. When compared with early-stage technology, late-stage has lower return characteristics, but considerably less volatility. In the year to 31 March 2006, 44% of our Venture Capital investment was in late-stage and we anticipate that this percentage could rise to as much as 70% in the near term.
We have therefore reviewed the return objectives for our Venture Capital business in the light of this changing mix, and adjusted both the volatility and the overall return objectives as a consequence. The new gross portfolio return objective for the business remains higher than that for Buyouts and Growth Capital at 25%, and vintage year and cyclical volatilities have been set at 15% and 7% respectively.
Investment and realisations
Investment for the 12 months to 31 March 2006 was £156 million (2005: £143 million). It is the team's objective to invest between £175 million and £225 million per annum.
Realisation proceeds of £207 million were 33% higher than last year (2005: £156 million). The increase in realisations reflects an increased appetite of corporate buyers and, to a degree, the public markets for venture capital companies. Six Venture Capital portfolio companies achieved a flotation during the year, with the healthcare, drug discovery and software sectors being particularly active.
Portfolio health
At 31 March 2006, 67% of our Venture investments were classified as healthy, against a three year rolling average of 65%. These levels are consistent with the higher risk return profile of venture capital investing.
Long-term IRRs
As previously noted, our Venture Capital business has increased its focus on late-stage investment and we have correspondingly adjusted our target for this business line's cash-to-cash IRRs to 25%.
The 2002 and 2003 vintages are behind target and we continue to manage this portfolio actively to improve returns. The 2004 vintage is the best performing recent vintage with strong value growth contributing to its success.

Jo Taylor
Managing Partner
Gross portfolio return on opening portfolio value
17%
Gross portfolio return
£128m
An improved gross portfolio return of 17% was driven by increased realisation profits arising from healthy M&A and IPO markets for young technology businesses, and the attractiveness of our portfolio to those markets.
The growth in new investment from £143 million to £156 million was encouraging and further demonstration of the attractiveness of our approach to serial entrepreneurs, high-growth companies and their large corporate partners.
Financial highlights (£m) for the year to 31 March 2006
| Gross portfolio return | 128 |
|---|---|
| Investment | 156 |
| Realisation proceeds | 207 |
| Realised profit | 72 |
| Unrealised value movement | 51 |
| Portfolio income | 5 |
Gross portfolio return by year (%) to 31 March

* Restated to exclude unrealised currency movements.
† Restated for the adoption of IFRS.
Long-term IRRs (£m) years to 31 March
| Venture Capital |
Total investment |
Return flow |
Value remaining |
IRR to date |
|---|---|---|---|---|
| 2006 | 64 | - | 65 | - |
| 2005 | 63 | - | 63 | - |
| 2004 | 132 | 36 | 181 | 36% |
| 2003 | 107 | 12 | 49 | (19)% |
| 2002 | 315 | 72 | 131 | (12)% |
Note: for an explanation of IRRs, please see Returns and IRRs - an explanation.
![3i - Go to home page [Accesskey '0']](images/generic/logo.gif)
