 |
BP - Annual F&O information - including pro forma data*
|
|
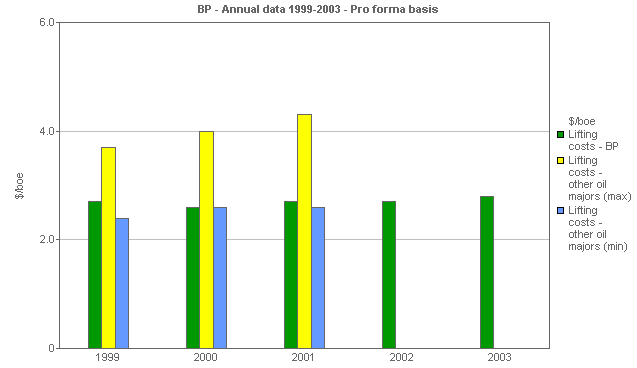
BP performance versus comparatives: Lifting costs
This clustered bar chart shows BP's lifting cost per barrel of oil equivalent compared with the maximum and minimum lifting costs of other major oil companies.
|
|
 |
|
|
|
Units
|
1999
|
2000
|
2001
|
2002
|
2003
|
|
E&P - comparatives & statistics - select from menu
|
|
|
|
|
|
|
|
Lifting costs - select from menu
|
|
|
|
|
|
|
|
Lifting costs - BP
|
$/boe
|
2.7
|
2.6
|
2.7
|
2.7
|
2.8
|
|
Lifting costs - other oil majors (max)
|
$/boe
|
3.7
|
4
|
4.3
|
|
|
|
Lifting costs - other oil majors (min)
|
$/boe
|
2.4
|
2.6
|
2.6
|
|
|
All the financial data for 1999 to 2003 has been restated to reflect (i) the transfer of NGLs operations from E&P to GP&R and (ii) the impact of change in ESOP accounting. Only data for 2002 and 2003 has been restated to reflect the adoption by the group of "Retirement Benefits Reporting Standard (FRS17)"
|
