 |
BP - Annual F&O information - including pro forma data*
|
|
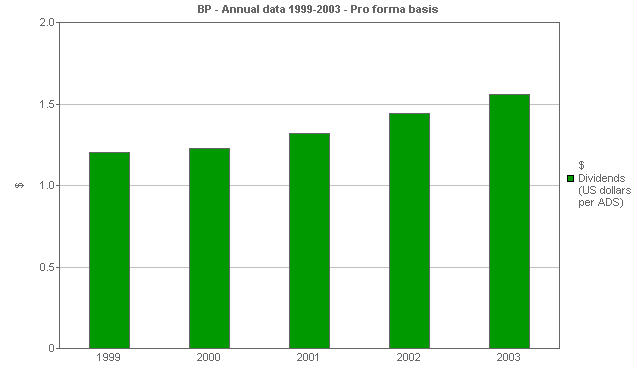
Dividends: Per ADS
This bar chart shows dividends declared per ADS (US dollars per ADS) and includes an average over the period.
|
|
 |
|
|
|
Units
|
1999
|
2000
|
2001
|
2002
|
2003
|
|
Dividends (annual declared) - select from menu
|
|
|
|
|
|
|
|
Dividends (US dollars per ADS)
|
$
|
1.2
|
1.23
|
1.32
|
1.44
|
1.56
|
All the financial data for 1999 to 2003 has been restated to reflect (i) the transfer of NGLs operations from E&P to GP&R and (ii) the impact of change in ESOP accounting. Only data for 2002 and 2003 has been restated to reflect the adoption by the group of "Retirement Benefits Reporting Standard (FRS17)"
|
