 |
BP - Annual F&O information - including pro forma data*
|
|
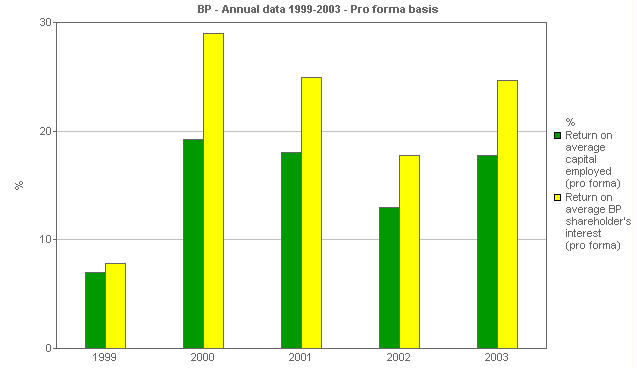
Ratios: Average returns
This clustered bar chart shows return on average capital employed (pro forma basis) compared with return on average BP shareholders' interest (pro forma basis).
|
|
 |
|
|
|
Units
|
1999
|
2000
|
2001
|
2002
|
2003
|
|
Ratios - Pro forma basis - select from menu
|
|
|
|
|
|
|
|
Return on average capital employed (pro forma)
|
%
|
7
|
19.2
|
18
|
13
|
17.8
|
|
Return on average BP shareholder's interest (pro forma)
|
%
|
7.8
|
29
|
24.9
|
17.8
|
24.7
|
All the financial data for 1999 to 2003 has been restated to reflect (i) the transfer of NGLs operations from E&P to GP&R and (ii) the impact of change in ESOP accounting. Only data for 2002 and 2003 has been restated to reflect the adoption by the group of "Retirement Benefits Reporting Standard (FRS17)"
|
