 |
BP - Annual data 2001- 2005
|
|
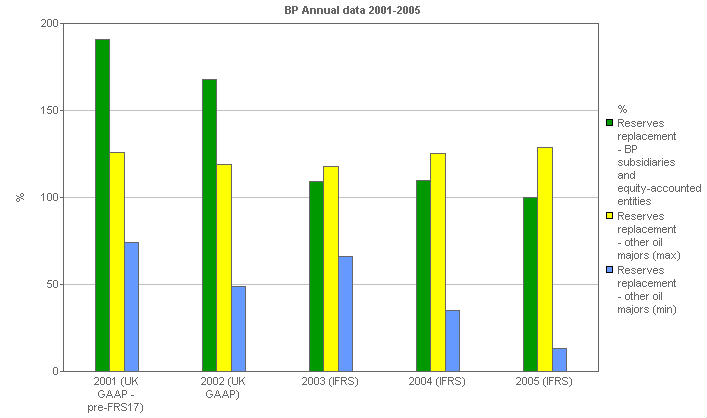
BP performance versus comparatives: Reserves replacement
This clustered bar chart shows BPs reserves replacement percentage compared with the maximum and minimum reserves replacement percentage of other major oil companies.
|
|
 |
|
|
|
Units
|
2001 (UK GAAP - pre-FRS17)
|
2002 (UK GAAP)
|
2003 (IFRS)
|
2004 (IFRS)
|
2005 (IFRS)
|
|
Cost of supply - BP (8)
|
$/boe
|
8.32
|
9.21
|
8.68
|
9.54
|
10.44
|
|
Reserves replacement - select from menu
|
|
|
|
|
|
|
|
Reserves replacement - BP subsidiaries and equity-accounted entities |
%
|
191.0
|
168.0
|
109.0
|
110.0
|
100.0
|
|
Reserves replacement - other oil majors (max)
|
%
|
126.0
|
119.0
|
118.0
|
125.0
|
129.0
|
|
Reserves replacement - other oil majors (min)
|
%
|
74.0
|
49.0
|
66.0
|
35.0
|
13.0
|
|
