 |
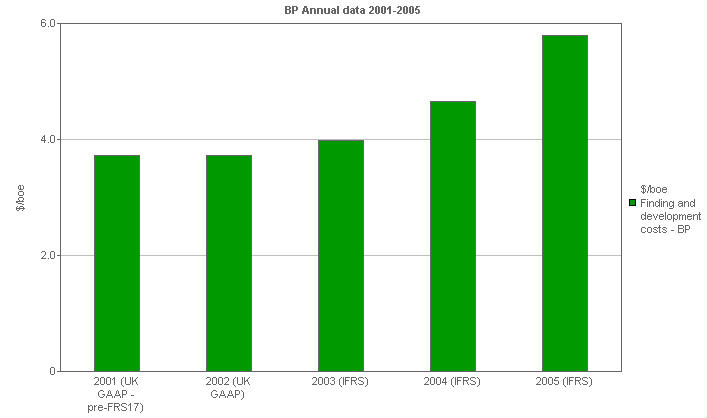
BP - Annual data 2001- 2005
|
|
BP performance versus comparatives: Finding and development costs
This clustered bar chart shows BP's finding and development cost per barrel of oil equivalent compared with the maximum and minimum finding and development costs of other major oil companies.
|
|
 |
|
|
|
Units
|
2001 (UK GAAP - pre-FRS17)
|
2002 (UK GAAP)
|
2003 (IFRS)
|
2004 (IFRS)
|
2005 (IFRS)
|
|
Finding and development costs - BP
|
$/boe
|
3.72
|
3.72
|
3.98
|
4.65
|
5.79
|
|
