 |
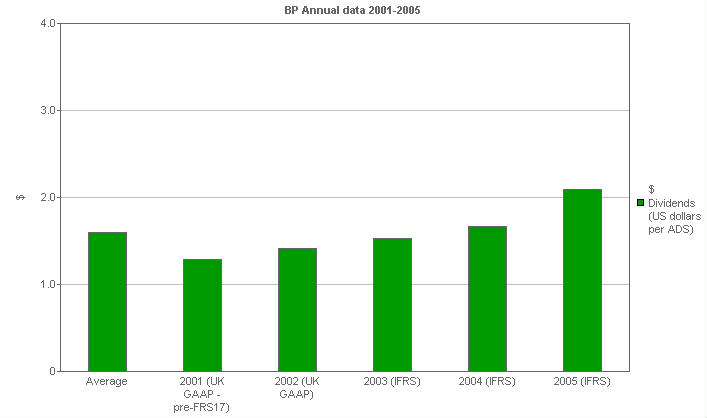
BP - Annual data 2001- 2005
|
|
Dividends: Per ADS
This bar chart shows dividends paid per ADS (US dollars per ADS) and includes an average over the period.
|
|
 |
|
|
|
Units
|
Average
|
2001 (UK GAAP - pre-FRS17)
|
2002 (UK GAAP)
|
2003 (IFRS)
|
2004 (IFRS)
|
2005 (IFRS)
|
|
Dividends (annual paid) - select from menu
|
|
|
|
|
|
|
|
|
Dividends (US dollars per ADS)
|
$
|
1.597
|
1.29
|
1.41
|
1.53
|
1.662
|
2.091
|
Under IFRS dividends are shown on a when "paid" rather than when "declared" basis and as such all the dividends are now shown on this basis.
|
