 |
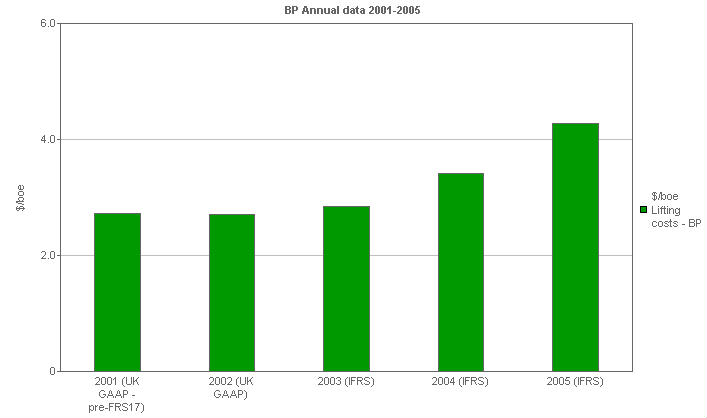
BP - Annual data 2001- 2005
|
|
BP performance versus comparatives: Lifting costs
This clustered bar chart shows BP's lifting cost per barrel of oil equivalent compared with the maximum and minimum lifting costs of other major oil companies.
|
|
 |
|
|
|
Units
|
2001 (UK GAAP - pre-FRS17)
|
2002 (UK GAAP)
|
2003 (IFRS)
|
2004 (IFRS)
|
2005 (IFRS)
|
|
Lifting costs - BP
|
$/boe
|
2.73
|
2.71
|
2.84
|
3.41
|
4.28
|
|
