Review
Financial management
Chief Investment Officer
Investment management
The Group’s cash and investments increased to £2.9 billion (2007: £2.6 billion). £547.5 million of the increase related to the translation effect of the weakening of sterling during 2008 on the nonsterling assets that the Group owns. Cash and investments represent a multiple of 2.4 times (2007: 2.5 times) shareholders’ equity.
Our investment process is led by setting our investment risk appetite. This is based on, amongst other things, the outlook for underwriting profits and the strength of our balance sheet, rather than by targeting an investment return. We aim to optimise returns for that level of risk through:
- Setting appropriate strategic asset allocations using both qualitative and quantitative analysis.
- Taking short-term tactical asset allocation positions around the strategic asset allocations.
- Identifying skilled external investment managers to manage the underlying assets.
Syndicate 2001 and Amlin Bermuda each have their own investment strategies because of the different levels of risk each is able to take. The combined strategies are also considered at a Group level to ensure that the overall level of investment risk remains appropriate. Distinction is drawn between capital assets and policyholders’ funds for each entity. Once the risk appetite has been determined, the strategic benchmarks for these assets are set using a combination of efficient frontier1 and value at risk2 models.
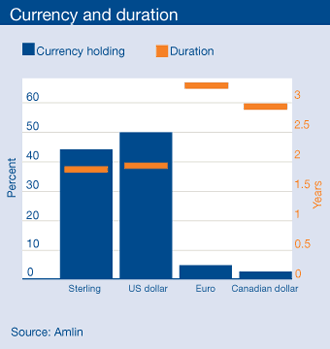
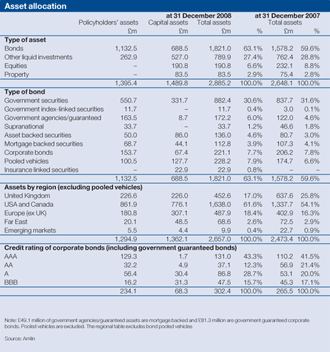
Policyholders’ funds are the premiums we receive and hold to meet future claims. It is therefore important that we ensure that cash is available to meet claims as they fall due. The duration of liabilities is reasonably short and we hold these assets in cash and short-dated bonds in the major liability currencies. The table analyses capital and policyholders asset allocation.

2008 presented unprecedented challenges for investment markets, with the crisis in the global financial system undermining an already deteriorating global economic outlook. Most risk assets came under pressure and volatility was extreme. In this context, our cautious investment management strategy and tactical asset allocation proved well judged, producing an investment return of 0.6% for the year.
The full extent of the financial crisis that hit markets in the autumn was difficult to anticipate. The subsequent need for institutions to deleverage meant that, in many cases, investors were forced to sell their highest quality assets in order to shore up their balance sheets, as these were the only assets with any material value and liquidity. As a result many non-government bonds finished the year with substantial liquidity premiums in excess of their credit risk premiums. That is, the price of bonds do not reflect their long term cash characteristics but rather what market participants can realise if assets are sold due to dislocation in investment markets.
Our average cash balance during the year was 31%, which is around three times the level we would usually hold. Cash is held in large AAA rated liquidity funds. On average 58% of the investment portfolio was held in short-dated bonds.

Click here for full sized image
The bond portfolios are benchmarked against government securities. However, we permit the investment managers to take non-benchmark positions. These non-government holdings led to substantial underperformance of our benchmarks. In particular, our holdings in asset/ mortgage backed securities and corporate bonds were hit hard. Although there has undoubtedly been a deterioration in fundamentals, some of this underperformance is due to the impact of deleveraging and should be made up as prices ‘pull to par’ on maturity.
The bond portfolio remains high quality, as illustrated by the asset allocation table shown above. Our asset/mortgage backed securities are high grade with 88.4% rated AAA and 3.2% AA. Only a small number of our bond holdings were downgraded during the year. At the year end financial sector (banks and other financial services) corporate bond exposure was 4.8%. In addition 2.8% was held in government guaranteed financial bonds. Our overall exposure to Tier 1 bank bonds, perpetual bonds which sit immediately above equity in bank capital structures, was only 0.3% or £7.9 million.
In total we had £4.3 million of exposure to corporate bonds where the connected company went into liquidation during the year. Some of this was recovered by subsequent sales and at the year end the exposure to impaired assets was not material.
The average allocation to equities during the year was 8%, 5% lower than its peak in 2007. However, the actual exposure held was even lower as we employed tactical hedges to derisk the portfolio, which provided some protection against the full extent of the decline in equity indices.
Judging the extent and duration of the global recession is exceptionally difficult and this makes us cautious about the outlook for risk assets.
However, while being cognisant of the need to maintain sufficient liquidity, we consider that selective, high quality corporate bonds or asset mortgage backed securities offers a good risk/ reward outlook for the medium-term. We expect to increase their weighting in the portfolios. We are vigilant about the prospect of higher government bond yields but believe that, in the short-term, the widening negative global output gap will mean that deflationary pressures prevail.
- The efficient frontier represents the combinations of securities that produce the maximum expected return for a given level of risk.
- VaR is a statistical measure, which calculates the possible loss over a year, in normal market conditions. As VaR estimates are based on historical market data this should not be viewed as an absolute gauge of the level of risk to the investments.
