Interim review
Group overview
As shown in table 1, 3i achieved a total return of £447 million (2004: £224 million) for the period, which equates to 12.1% on restated opening shareholders' funds. Total return is equivalent to the IFRS accounting measure of "total recognised income and expense" used in the financial statements.| 6 months to 30 September 2005 £m |
6 months to 30 September 2004 (as restated)* £m |
|
|---|---|---|
| Realised profits on disposal of investments | 189 | 89 |
| Unrealised profits on revaluation of investments | 223 | 86 |
| Portfolio income | 109 | 126 |
| Gross portfolio return | 521 | 301 |
| Fund management fee income | 15 | 14 |
| Net carried interest and investment performance plans | 31 | (24) |
| Operating expenses and share-based payments | (96) | (83) |
| Net portfolio return | 471 | 208 |
| Net interest payable | (12) | (25) |
| Exchange movements | 35 | 32 |
| Movements in the fair value of derivatives | (33) | 9 |
| Other | 1 | (1) |
| Profit after tax | 462 | 223 |
| Revaluation movements (pension, property and currency translation) | (15) | 1 |
| Total recognised income and expense ("Total return") | 447 | 224 |
The gross portfolio return for the period was 12.1% (2004: 6.9%) on the opening portfolio value, reflecting the high level of realisations achieved at good uplifts to carrying value and continued value growth within the portfolio. An analysis of the gross portfolio return by business line is shown in table 2.
| Buyouts | Growth Capital |
Venture Capital |
SMI | Total | ||||||
| 2005 |
2004 |
2005 |
2004 |
2005 |
2004 |
2005 |
2004 |
2005 |
2004* (as restated) |
|
|---|---|---|---|---|---|---|---|---|---|---|
| Gross portfolio return | 199 | 145 | 168 | 93 | 61 | 23 | 93 | 40 | 521 | 301 |
| Return as % of opening portfolio |
13.1% | 9.8% | 13.0% | 7.7% | 8.2% | 3.4% | 12.3% | 4.2% | 12.1% | 6.9% |
| Net portfolio return | 471 | 208 | ||||||||
| Return as % of opening portfolio | 10.9% | 4.8% | ||||||||
| Total return | 447 | 224 | ||||||||
| Total return as % of opening shareholders’ funds | 12.1% | 6.8% | ||||||||
The net portfolio return on the opening portfolio value, after deduction of operating expenses and carried interest payable to our investment teams, and inclusion of carried interest and management fees receivable in respect of our third party funds, was 10.9% (2004: 4.8%).
3i invested a total of £706 million (£835 million including investment on behalf of co-investment funds), which is significantly up on levels invested in both the first half (£422 million) and the second half (£333 million) of the last financial year. An analysis of the amount invested, by business line and geography, is given in table 4. As previously indicated, the investment pipeline coming into the current financial year was strong and we were able to convert much of this during the period. In addition, particularly within Growth Capital, we have been targeting significantly larger investment opportunities and our average deal size during the period increased.
3i generated realisation proceeds of £1,041 million (2004: £603 million) during the period, reflecting a profit over 31 March 2005 values of £189 million (22% uplift), compared with £89 million (17%) in the equivalent period last year. The uplift over 31 March 2005 values on realisations of equity investments was 34% (2004: 28%). Realised profits are stated net of write-offs, which amounted to £40 million (2004: £13 million). Overall, 19.7% of the opening portfolio (by value) was realised during the period (2004: 12%), which is significantly higher than we have achieved in any six month period over recent years. An analysis of realisation proceeds by business line and geography is provided in table 5 and a summary of changes to our portfolio in table 3.
| 6 months to 30 September 2005 £m |
6 months to 30 September 2004 (as restated)* £m |
|
|---|---|---|
| Opening portfolio | 4,317 | 4,362 |
| Investment | 706 | 422 |
| Realisation proceeds | (1,041) | (603) |
| Realised profits on disposal of investments | 189 | 90 |
| Unrealised profits on revaluation of investments | 223 | 86 |
| Other | (5) | 40 |
| Closing portfolio | 4,389 | 4,397 |
| UK | Continental Europe |
US | Asia | Total | ||||||
| 2005 | 2004 | 2005 | 2004 | 2005 | 2004 | 2005 | 2004 | 2005 | 2004 | |
|---|---|---|---|---|---|---|---|---|---|---|
| Buyouts | 154 | 82 | 204 | 118 | - | - | - | - | 358 | 200 |
| Growth Capital | 109 | 45 | 141 | 85 | - | 1 | 36 | 12 | 286 | 143 |
| Venture Capital | 18 | 20 | 12 | 17 | 28 | 34 | - | 1 | 58 | 72 |
| SMI | 2 | 5 | 2 | 2 | - | - | - | - | 4 | 7 |
| Total | 283 | 152 | 359 | 222 | 28 | 35 | 36 | 13 | 706 | 422 |
| UK | Continental Europe |
US | Asia | Total | ||||||
| 2005 | 2004 | 2005 | 2004 | 2005 | 2004 | 2005 | 2004 | 2005 | 2004 | |
|---|---|---|---|---|---|---|---|---|---|---|
| Buyouts | 178 | 141 | 201 | 75 | - | 2 | - | - | 379 | 218 |
| Growth Capital | 135 | 203 | 169 | 41 | 42 | - | 35 | 1 | 381 | 245 |
| Venture Capital | 56 | 46 | 49 | 6 | 15 | 6 | - | - | 120 | 58 |
| SMI | 135 | 55 | 26 | 26 | - | 1 | - | - | 161 | 82 |
| Total | 504 | 445 | 445 | 148 | 57 | 9 | 35 | 1 | 1,041 | 603 |
| 6 months to 30 September 2005 £m |
6 months to 30 September 2004 (as restated)* £m |
|
|---|---|---|
| Earnings multiples1 | 66 | 18 |
| Earnings2 | 27 | 22 |
| First-time uplifts3 | 23 | 32 |
| Provisions4 | (37) | (44) |
| Up/(down) rounds | (3) | 21 |
| Uplift to imminent sale | 128 | 85 |
| Other movements on unquoted investments | (39) | (42) |
| Quoted portfolio | 58 | (6) |
| Total | 223 | 86 |
- The weighted average earnings multiple applied to investments valued on an earnings basis increased from 12.0 to 12.2 over the period. For those investments valued on an earnings basis at both the start and end of the period, the weighted average earnings multiple increased from 11.9 to 12.3.
- The aggregate attributable earnings of investments valued on an earnings basis at both the start and end of the period increased by 2%.
- The net valuation impact arising on investments being valued on a basis other than cost for the first time.
- Provisions against the carrying value of investments in businesses which may fail.
During the period, eight portfolio companies achieved IPOs across seven different markets, including Revus Energy (Oslo), Interhyp (Frankfurt) and Focus Media (NASDAQ). Sales to financial purchasers through secondary buyouts represented £317 million of proceeds and we generated £66 million of proceeds through refinancing portfolio businesses. Sales of quoted equities benefited from the general rise in equity markets, with proceeds of £117 million and a profit of £30 million (34%) over 31 March 2005 valuations.
Back to top
Buyouts
The European mid-market for buyouts continued to be highly competitive in terms of investment opportunities, reflecting the substantial amounts raised recently by buyout funds and the continuing high availability of debt. Despite this, we believe we have been able to secure some good opportunities at attractive prices. During the period, we invested £304 million in 10 transactions and a further £54 million in supporting existing portfolio companies. Investments made include NCP, the UK-based provider of transport management and parking services, Giochi Preziosi, the Italian toy manufacturer, and Carema, the Swedish specialist care business.Realisation conditions were favourable during the period, with strong competition among both corporate and financial buyers of businesses, more active IPO markets and supportive debt markets. These conditions enabled us to generate £379 million in proceeds at an aggregate uplift over 31 March 2005 carrying values of £62 million (20%). Major contributors were Yellow Brick Road, the telephone directories group, on which we generated a further £129 million of proceeds, and Travelex, the foreign currency services provider, where we realised a further £93 million of proceeds in the period.
In addition, the Buyout business generated realisation proceeds of £284 million on behalf of third party funds managed by 3i.
Unrealised value movement was £79 million (2004: £76 million), driven mainly by assets being valued on an imminent sale basis, earnings multiple enhancements and a number of first time uplifts (valuation increases due to assets being valued on a basis other than cost for the first time). Portfolio income totalled £58 million (2004: £47 million).
Back to top
Growth Capital
Within Growth Capital, we have been successful in originating a number of investment opportunities as businesses have sought to expand regionally and internationally. Investment was strong in the period, as we converted a number of opportunities within our pipeline and benefited from our focus on larger deals. We invested £286 million, comprising £203 million in 10 "first" investments (in which 3i had not previously invested), £37 million of "further" investment into existing portfolio companies and £46 million into the I2 infrastructure fund, which targets projects in the health, education, transport and defence sectors in the UK. The average deal size for first investments was £27 million, up from £7 million for the previous financial year. Investments made include Boxer, the Stockholm-based digital TV operator, and Hayley, the UK-based operator of conference centres.Growth Capital realisations were strong, generating £381 million of proceeds at an uplift over 31 March 2005 carrying values of £60 million (19%). This is net of realised value losses on Incline Global Technology Services, the UK-based repairer of flat panel displays (£28 million), and Allsports, the UK sports goods retailer (£5 million), both of which went into administration during the period.
Unrealised value movement was £86 million (2004: £(3) million). This included £69 million in respect of Petrofac, the oilfield services business, which achieved a £742 million IPO on the London Stock Exchange in early October 2005, providing 3i with a full exit and proceeds of £116 million on our 2002 investment of £21 million. Portfolio income totalled £22 million (2004: £46 million), the reduction relative to 2004 being primarily due to reduced levels of special dividends receivable on realisations of investments.
Back to top
Venture Capital
Venture capital investment conditions in both Europe and the US were competitive for good later-stage investment opportunities, but much less so for start-up and early-stage opportunities. The relatively low amount invested (£58 million) reflects both our view of pricing levels for high-quality opportunities and our focus during the period on portfolio management and exits. Of the amount invested by Venture Capital, 84% was further investment into existing portfolio companies.Realisation conditions were much improved, with both IPOs and sales to corporate acquirers becoming more prevalent. We generated proceeds of £120 million in the period, at an uplift over 31 March 2005 carrying values of £36 million (43%). Notable realisations were dtms, the German telecommunications solutions provider, UbiNetics, the "3G" mobile wireless software company, and Searchspace, the UK artificial intelligence software company.
Unrealised value movement was £23 million (2004: £12 million), the main contributors being valuation increases arising on the IPO of portfolio companies and rises in the share prices of quoted assets. Portfolio income totalled £2 million (2004: £1 million).
Back to top
SMI
SMI continued to be successful in realising assets from its portfolio. The gross portfolio return of 12% is largely attributable to a number of good realisations of higher value assets, including Cannon Avent, the baby products business, McMullen & Sons, the brewing and pubs business, and EAT, the operator of coffee and sandwich bars.Carried interest and investment performance plans
The charge for the period in respect of amounts payable to our investment staff under carried interest schemes and investment performance plans was £26 million (2004: £25 million).Carried interest receivable for the period of £57 million (2004: £1 million) relates primarily to Eurofund III, 3i's 1999 pan-European fund, whose cumulative performance has now passed through the point at which recognition of carried interest receivable within 3i's financial statements is triggered. This resulted in a net carried interest receivable for the period of £31 million (2004: £24 million payable).
Back to top
Costs
Operating expenses totalled £92 million (2004: £80 million) in the period. The increase over 2004 reflects a number of factors, including higher remuneration costs and costs associated with the strategic development of the business. Staff headcount at the period end stood at 732 (2004: 740).The charge in respect of share-based payments, to reflect the fair value of options granted to employees, was £4 million (2004: £3 million).
Net interest payable for the period was £12 million (2004: £25 million), reflecting the lower average net borrowings compared to the equivalent period last year and an increase in the proportion of borrowings in non-sterling currencies for which interest rates are currently more favourable.
We incurred an unrealised value movement of £33 million (2004: gain of £4 million) as a result of marking derivatives to fair value. Of this, £14 million relates to the derivative element of the €550 million Convertible Bonds due 2008, where the increase in 3i's share price over the period was a significant factor.
Back to top
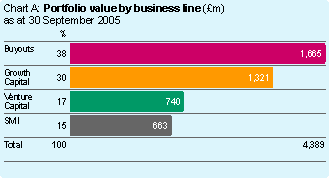

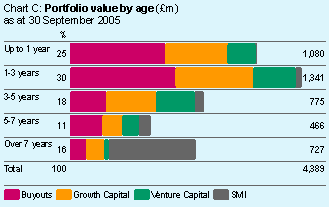
The portfolio
Charts A and B show the portfolio analysed by business line and geography respectively and chart C shows the age profile of the portfolio.The number of investments in the portfolio (excluding SMI) fell from 695 at the start of the period to 609 at the end, reflecting the high level of realisations achieved.
The number of investments in the SMI portfolio fell from 807 at the start of the period to 676 at the end. Within this portfolio, the largest 20 investments by value represented 31% of the total value as at 30 September.
Cash flows and capital structure
Net cash outflow for the period was £192 million (2004: £64 million inflow). Net borrowings at the period end increased to £752 million from £545 million at 31 March 2005. The level of gearing rose from 15% as at 31 March 2005 (restated) to 20% at 30 September.The above numbers reflect the progress to-date on the £500 million return of capital to shareholders, which was approved by shareholders on 6 July. A special dividend of £245 million was paid to shareholders in July and, as at 30 September, £151 million of share purchases had been made under the share buy-back programme. Since 30 September, a further £47 million of share purchases have been made.
Back to top
Valuation policy
There have been no significant changes to 3i's valuation methodology in the period. In order to comply with IFRS, discounts are no longer applied to market prices in valuing our quoted investments and investments are valued at bid price rather than mid price. As a result, the carrying value of our quoted portfolio at the period end was £27 million higher (31 March 2005: £25 million higher) than it would have been under the previous methodology.Changes to accounting policies
As set out on in the Basis of preparation, 3i has adopted IFRS for the first time this period. As a result, certain accounting policies and methods have been amended to comply with IFRS. The comparative figures in respect of 2004 have been restated to reflect these adjustments.Details of the principal accounting policies and the restatement of the prior year results, including restatement of the balance sheet as at 31 March 2005, are set out on in the Transition to IFRS.
Back to top