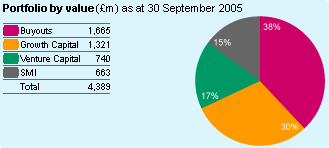
3i is a world leader in private equity and venture capital. We focus on Buyouts, Growth Capital and Venture Capital and invest across Europe, in the United States and in Asia.
Our competitive advantage comes from our international network and the strength and breadth of our relationships in business. These underpin the value that we deliver to our portfolio and to our shareholders.
Financial highlights


Realisation proceeds
£1,041m
Dividend per share
5.5p
Return on opening shareholders' funds
12.1%
Total return*
£447m
| 6 months to 30 September 2005 |
6 months to 30 September 2004 (as restated)** |
|
|---|---|---|
| Total return on opening shareholders' funds | 12.1% | 6.8% |
| Diluted net asset value per share | 677p | 574p |
| Interim dividend per share | 5.5p | 5.3p |
| Realised profits over opening valuation on disposal of investments | £189m | £89m |
| New investment - Including co-investment funds |
£706m £835m |
£422m £521m |
| Realisation proceeds - Including co-investment funds |
£1,041m £1,363m |
£603m £792m |
| * Total return is equivalent to the accounting measure of "Total recognised income and expense". ** Restated comparatives reflect the adoption of International Financial Reporting Standards ("IFRS"), as explained within the Basis of preparation. |
||
| Gross portfolio return (%) | 6 months to 30 September 2005 |
6 months to 30 September 2004 (as restated)** |
|---|---|---|
| Buyouts | 13.1 | 9.8 |
| Growth Capital | 13.0 | 7.7 |
| Venture Capital | 8.2 | 3.4 |
| Smaller Minority Investments ("SMI") | 12.3 | 4.2 |