
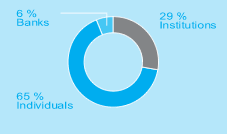
As at 31 December 2003, Eurotunnel had more than one million shareholders (2002: more than 700,000).
Individual shareholders represented approximately 65% of the share capital (43% as at 31 December 2002), of which approximately 10% UK registered and 90% French registered or bearer shareholders.
Average interest rate 4.9%
Total Turnover
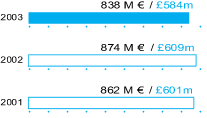
(1 £ = 1,435 € / £1= €1.435)
With revenues from transport activities standing at £541 million and those from non-transport activities at £25 million, total revenues are down 5%. Total turnover is down 4% at £584 million.
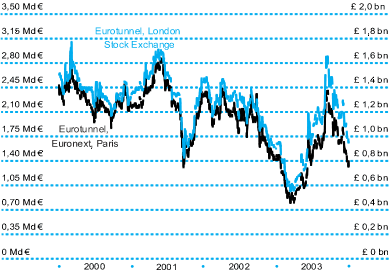
Market Capitalisation
Operating Profit
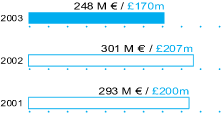
(1 £ = 1,435 € / £1= €1.435)
Operating profit stands at £170 million, down 18% compared with 2002. At £259 million, operating expenditure has remained stable though depreciation and provisions increased by £5 million.
Paris Share Price
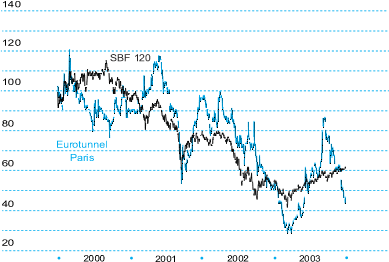
Indexed to 31 December 1999
Equity and long term debt
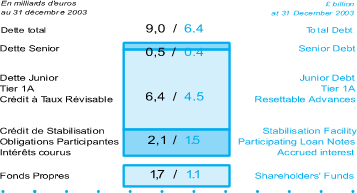
(1 £ = 1,419 € / £1= €1.419)
In 2003, Eurotunnel reduced its debt by £155 million thanks to a series of financial operations. At end December 2003, Eurotunnel redeemed its Equity Notes by issuing new Units, representing approximately 7.75% of Eurotunnel’s capital prior to issue. No debt repayments are due before 2006.
London Share Price
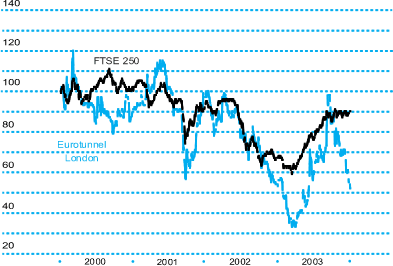
Indexed to 31 December 1999



 Next Page
 Previous Page