
BP - Health & Safety Data homepage
DAFWCF (Group)
DAFWC (Group)
RIF (Group)
RI (Group)
Fatality rate (Group)
Fatalities (Group)
Cumulative change (All rates)
Business segment comparisons (RI)
Business segment comparisons (DAFWC)
|
|
|
BP - Health & Safety Data
|
|
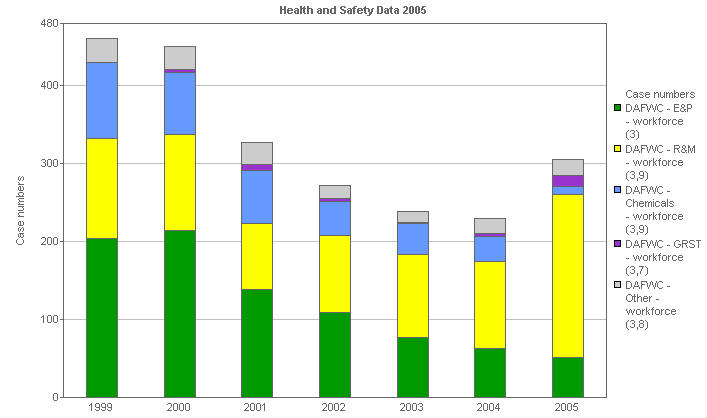
Business segment comparisons (DAFWC)
This stacked bar chart shows the number of Days Away From Work Cases for the BP Group workforce, analyzed by business segment. This is measured by the number of incidents that resulted in an injury or illness where a person is unable to work for a day (shift) or more. Prior to 2003, illness was included in this category.
|
|
 |
|
| | Units | 1999 | 2000 | 2001 | 2002 | 2003 | 2004 |
|---|
| DAFWC - Group workforce (3) | Case numbers | 461 | 450 | 327 | 272 | 239 | 230 |
|---|
| DAFWC - E&P - workforce (3) | Case numbers | 204 | 214 | 138 | 109 | 77 | 63 |
|---|
| DAFWC - R&M - workforce (3,9) | Case numbers | 128 | 124 | 85 | 99 | 107 | 111 |
|---|
| DAFWC - Chemicals - workforce (3,9) | Case numbers | 98 | 79 | 68 | 43 | 39 | 32 |
|---|
| DAFWC - GRST - workforce (3,7) | Case numbers | 0 | 4 | 8 | 4 | 1 | 4 |
|---|
| DAFWC - Other - workforce (3,8) | Case numbers | 31 | 29 | 28 | 17 | 15 | 20 |
|---|
| | Units | 2005 |
|---|
| DAFWC - Group workforce (3) | Case numbers | 305 |
|---|
| DAFWC - E&P - workforce (3) | Case numbers | 51 |
|---|
| DAFWC - R&M - workforce (3,9) | Case numbers | 209 |
|---|
| DAFWC - Chemicals - workforce (3,9) | Case numbers | 11 |
|---|
| DAFWC - GRST - workforce (3,7) | Case numbers | 14 |
|---|
| DAFWC - Other - workforce (3,8) | Case numbers | 20 |
|---|
(3) DAFWC - Days Away From Work Cases. The number of incidents that resulted in an injury where a person is unable to work for a day (shift) or more. Prior to 2003, illness was included in this category.
(7) Gas Power and Renewables included renewables business operations (including BP Solar) from 2002 onwards.
(8) 'Other' businesses included in 2002 onwards shipping, aluminum, and BP corporate functions/offices.
|
|
