
BP - Health & Safety Data homepage
DAFWCF (Group)
DAFWC (Group)
RIF (Group)
RI (Group)
Fatality rate (Group)
Fatalities (Group)
Cumulative change (All rates)
Business segment comparisons (RI)
Business segment comparisons (DAFWC)
|
|
|
BP - Health & Safety Data
|
|
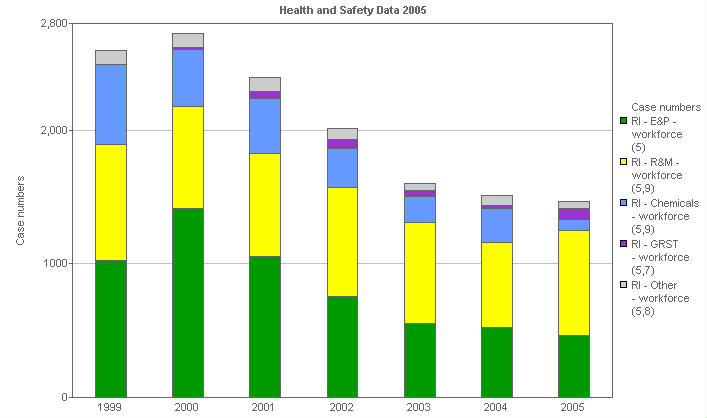
Business segment comparisons (RI)
This stacked bar chart shows the number of cases of Recordable Injury for Group workforce, analyzed by business segment. This is measured by the number of work related incidents that result in injuries or caused fatality, loss of consciousness, restriction of work or motion, transfer to another job, or require treatment beyond first aid. Prior to 2003, illness reporting was included in this category.
|
|
 |
|
| | Units | 1999 | 2000 | 2001 | 2002 | 2003 | 2004 |
|---|
| RI - Group - workforce (5) | Case numbers | 2,596 | 2,726 | 2,392 | 2,012 | 1,604 | 1,513 |
|---|
| RI - E&P - workforce (5) | Case numbers | 1,026 | 1,413 | 1,053 | 757 | 553 | 522 |
|---|
| RI - R&M - workforce (5,9) | Case numbers | 867 | 766 | 770 | 818 | 757 | 637 |
|---|
| RI - Chemicals - workforce (5,9) | Case numbers | 599 | 424 | 414 | 292 | 198 | 254 |
|---|
| RI - GRST - workforce (5,7) | Case numbers | 2 | 21 | 55 | 61 | 41 | 27 |
|---|
| RI - Other - workforce (5,8) | Case numbers | 102 | 102 | 100 | 84 | 55 | 73 |
|---|
| | Units | 2005 |
|---|
| RI - Group - workforce (5) | Case numbers | 1,471 |
|---|
| RI - E&P - workforce (5) | Case numbers | 465 |
|---|
| RI - R&M - workforce (5,9) | Case numbers | 783 |
|---|
| RI - Chemicals - workforce (5,9) | Case numbers | 86 |
|---|
| RI - GRST - workforce (5,7) | Case numbers | 81 |
|---|
| RI - Other - workforce (5,8) | Case numbers | 56 |
|---|
(5) RI Recordable Injury. The number of work-related incidents that result in injuries or that caused fatality, loss of consciousness, restriction of work or motion, transfer to another job, or require treatment other than simple first aid.
(7) Gas Power and Renewables included renewables business operations (including BP Solar) from 2002 onwards.
|
|
