| |
| |
|
|
| |
Building Products – Key market drivers: |
|
| |
 |
Residential housing starts |
 |
Square feet of construction |
 |
Construction value |
 |
Architectural billings |
 |
Office vacancy rates |
|
|
| |
|
|
|
|
| |
|
|
|
| |
|
| |
|
|
| |
Key market trends:
Non-residential construction (16.5% of ongoing Group sales) |
|
| |
 |
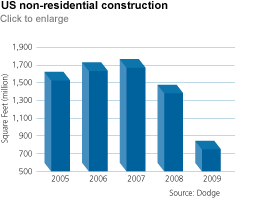
Non-residential construction declined by 46% by area and 33% by value (as measured by Dodge). |
 |
Office vacancy rates in the US are continuing to rise, implying further contraction in activity. |
 |
The US Architectural Billings Index remained below 50, implying contraction continuing into 2010. |
 |
Increasing focus on ‘green’ buildings through demand for LEED-certified buildings. |
|
|
| |
|
|
| |
Residential construction (8.0% of ongoing Group sales) |
|
| |
 |
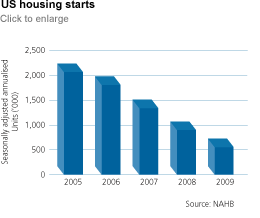
Residential construction declined by 30% by area and 31% by value (as measured by Dodge). |
 |
Annual housing starts in the US were 554,000 units in 2009, a decline of 39% compared to 2008. |
 |
Inventories of unsold homes in the US decreased, standing at 7.2 months for existing homes and 8.1 months for new homes at the end of 2009. |
 |
House prices in the US rose month-on-month in the second half of the year, but remained below 2008 levels. |
|
|
| |
|
|
|
|
| |
|
|
|
|
  |


