
 |
|
| Simon Laffin Group Finance and Property Director |
|
 |
|
 |
|
 |
|
 |
|
| *1998 group net margin is before the costs of the store portfolio review and redundancy programme. | |
- 11% growth in profit (before property and tax) to £355 million
- Two year profit growth of 45%
- 11% growth in earnings per share (pre property)
- 5% like-for-like sales growth
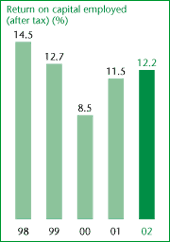
- Return on capital employed up to 12.2% (last year 11.5%)
- Gearing down by 3%, reflecting stable net debt
Sales growth
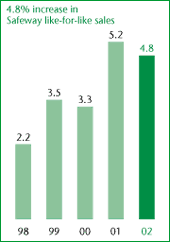
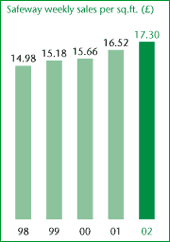
Our commercial strategy continued to drive strong sales during the year. Sales growth in like-for-like stores was 4.8%, similar to last year, and a further 0.2% was contributed by net new space, reflecting new store openings in Wimbledon and Woking in the first half. Total sales grew by 5.1% to £9.4 billion, of which 0.1% came from an extra Easter trading period. Sales per square foot averaged £17.30 in the year, an increase of 4.7% over the previous year.
| % Growth | 1st half |
2nd half |
Full year |
|||
| Like-for-like: | ||||||
| Inflation | 1.3 | (0.4 | ) | 0.5 | ||
| Volume | 4.4 | 4.2 | 4.3 | |||
| Total | 5.7 | 3.8 | 4.8 | |||
| Net new space | 0.2 | 0.1 | 0.2 | |||
| Easter* | – | 0.3 | 0.1 | |||
| Total | 5.9 | 4.2 | 5.1 | |||
| *Two Easter trading periods in year | ||||||
Sales in the first half grew by 5.9%, including like-for-like growth of 5.7%. Indeed, our second quarter trading statement marked the eighth consecutive quarter of like-for-like sales growth in excess of 5%, all achieved with minimal contribution from maturing space, store extensions or closures, and against the background of the second anniversary of the introduction of our deep cut promotional programme in September 1999.
The pace of growth slowed during the second half as the store reformat programme accelerated, with the sales lost from stores undergoing transformation greater than the sales gained from those relaunched. The step up in the reformat programme was particularly marked in the fourth quarter, which included construction work on four megastore extensions which will not be relaunched until the end of the first quarter of the current year. Of the 55 store reformats completed in the second half, 29 were finished in March and are being relaunched in the first quarter of this year. The benefit of these reformats, together with the launch of the four megastores, will therefore be felt progressively in the current year.
Our 12 JV stores in Northern Ireland continued to make good progress, breaking through the £200 million per annum sales barrier following a like-for-like increase of 11% in the year, representing the third consecutive year of double-digit growth. Our Safeway/BP convenience store chain contributed £360 million sales, of which our share is £180 million.
Effectiveness programme driving sales growth
In last year’s financial review I mentioned that, in order to fund the increases in price competitiveness, on-shelf availability and customer service needed to drive further sales growth, we had doubled our effectiveness programme to target 0.8% sales in 2001/2. I am delighted to report that we achieved this goal, producing savings in excess of £70 million.
Key amongst these efficiency projects was a programme aimed at reducing product wastage, through a combination of reduced lead times on deliveries, new systems in depots and in-store and increased store manager discretion in terms of product ordering. As a result wastage as a percentage of sales fell by 40% in 2001/2 versus the previous year.
Other areas successfully targeted by the effectiveness programme included distribution (benefiting from network investment in the previous year), store labour (particularly night replenishment processes and improved stock management) and certain support areas, where a variety of systems enhancements have driven down costs.
Net margin
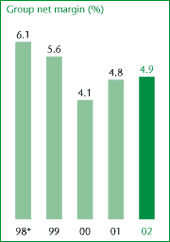
The significance of our effectiveness programme in funding investment to drive sales can be seen in the analysis of the year on year movement in the net margin below:
| 1st half |
2nd half |
Full Year |
||||
| % | % | % | ||||
| Gross margin | (0.6 | ) | 0.4 | (0.2 | ) | |
| Store wages | (0.1 | ) | (0.3 | ) | (0.2 | ) |
| Distribution costs | (0.1 | ) | 0.1 | – | ||
| Effectiveness | 0.8 | 0.7 | 0.8 | |||
| Transitional costs | (0.1 | ) | (0.4 | ) | (0.2 | ) |
| Other | – | (0.3 | ) | (0.1 | ) | |
| Overall change | (0.1 | ) | 0.2 | 0.1 | ||
 |
|
 |
|
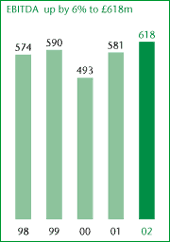
| EBITDA calculated as operating profit (inc. share of BPJV), with depreciation and loss on disposal of fixed assets added back. | |
 |
|
| ROCE for 1998 is before the costs of the store portfolio review and redundancy programme. Figures for the years to 2001 have been restated following the adoption of FRS 19. | |
 |
|
 |
|
The transitional revenue costs of our reformat programme were £34 million (up by 0.2% sales compared with last year’s £13 million). These costs represent asset write-offs, re-merchandising staff costs, repairs and marketing relaunch costs. In addition, £36 million, equivalent to 0.4% sales, has been allocated to bonuses for all employees (£9 million, or 0.1% sales, more than last year).
Overall net margin was up 0.1% year on year. The combination of this net margin improvement and 5% sales growth has enabled us to deliver our profit growth in the year.
Profit growth
Group operating profit totalled £417 million, up £22 million (5%) on the previous year. Excluding the impact of higher depreciation costs, EBITDA grew by 6% to £618 million, including 9% in the second half. Strong cash flow enabled profit before tax and net property losses to rise by 11% to £355 million. After net property losses, profit rose by 13%.
| 1st half |
2nd half |
Full Year |
||||
| % Growth | % | % | % | |||
| EBITDA | 3 | 9 | 6 | |||
| Operating profit | 3 | 8 | 5 | |||
| Profit after interest | 8 | 14 | 11 | |||
| Profit before tax | 9 | 17 | 13 | |||
As already mentioned, the additional revenue costs of our reformatting performance were £34 million (last year £13 million). Excluding these costs, operating profit rose by 11% and profit before tax and net property losses by 17% (£56 million).
| % Growth | 2002 £m |
2001 £m |
Increase % |
|||
| Profit before tax* | 355 | 320 | 11 | |||
| Transitional costs | 34 | 13 | ||||
| Underlying profit before tax* | 389 | 333 | 17 | |||
| *before net property losses | ||||||
Taxation, earnings and dividends
We have provided £110 million for corporation tax at a rate of 31% of our profit after interest. This compares with a rate of 32.3% last year, as restated following the implementation of FRS 19, the new accounting standard requiring full provision for deferred tax. Had we not adopted FRS 19, the group’s effective rate of tax would have been 27.7% in 2001/2.
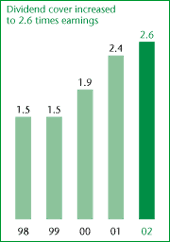
Earnings per share before property losses increased by 11% to 24.5p. Diluted earnings per share (which reflect the impact of outstanding share options) rose by 13% to 24.0p.
The Board is recommending an increase of 5% in the final dividend to 6.61p per share (last year 6.30p) bringing the full year payment to 9.52p (last year 9.07p), also up by 5%.
Format programme
At the core of New Safeway is the ambition to create a higher quality business and a stronger consumer franchise. Because our new formats feature new ranges, new services and focus on fresh foods, they also have fundamentally different economics, with a more profitable sales mix, largely driven by higher fresh foods participation, and higher costs as we seek to deliver great service through well-trained, skilled staff.
As more of our reformatted stores have come on stream, we have derived a much clearer understanding of what drives sales, the optimum balance between full margin sales and promotional sales, how to drive fresh foods participation and the consequential increase in gross margin. As these reformatted stores reach mature sales, our priorities are shifting towards fine tuning staffing levels and accelerating an already strengthening profit flow. We are confident that this programme is on track to deliver our target returns.
New Safeway progress
Early sales uplifts in fully reformatted stores have been encouraging, particularly in view of their reduced reliance on promotions to attract new customers and drive sales. The average sales increase from our reformatted stores in the second half was 10%, including fresh foods sales growth of 15%. Because so many of the reformats carried out during the year were not completed until March, it is too early yet to see the impact of these sales increases on the overall group number. The benefit of these reformats, together with the launch of four megastores, will therefore be felt progressively during 2002/3.
Fresh foods mix improved by 2.5 percentage points in New Safeway. At our concept stores in St Katharine Docks, Wimbledon, Woking, and Kensington High Street, this fresh foods mix now exceeds 50% of total sales, and because fresh food gross margins are significantly higher, this better mix naturally flows through into better gross margins. In addition, with greater investment in fresh food counters, enhanced levels of customer service should ensure that we are less reliant on promotions to drive sales.
Whilst there are higher gross margins there are also some increased operating costs, particularly in store wages with more counters and higher service levels. However, we continue to seek productivity and method improvements which will further enhance the New Safeway economics. We are also applying the lessons learnt so far in reducing the cost of a typical store reformat whilst still delivering dramatic improvements to our retail offer. Excluding the megastore extensions, we will reduce the average cost of refits to £1.5 million this year (last year £2.4 million).
Format roll-out
The roll-out of our new formats continues to go well. Including Plymstock megastore and two new stores, Wimbledon and Woking, which opened last May, we reformatted 73 stores during the year. Of these 73 stores, 55, representing 13% of our total sales areas, were completed in the second half.
| 2000/01 | 2001/02 | |||||||||
| Number of stores | Full Year |
1st half |
2nd half |
Full Year |
Total to date |
|||||
| Megastores | – | – | 1 | 1 | 1 | |||||
| Superstores | 2 | 6 | 29 | 35 | 37 | |||||
| Supermarkets | 39 | 7 | 20 | 27 | 66 | |||||
| Convenience | 7 | 5 | 5 | 10 | 17 | |||||
| 48 | 18 | 55 | 73 | 121 | ||||||
| % Total sales area | 9% | 4% | 13% | 17% | 26% | |||||
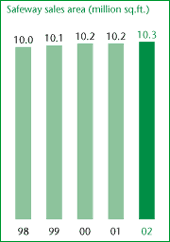
During the year we extended seven stores and one megastore, adding a total of 68,000 square feet of sales area. Our programme for the current year will accelerate to around 100 reformats, representing a further 26% of our sales area and including four megastores and up to ten smaller extensions.
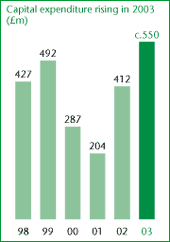
In total the group invested £412 million of capital expenditure last year, including £280 million on existing stores.
 |
|
A summary of the group’s treasury policies, including details of borrowing facilities, is provided in Note 15 to the accounts. The principal treasury objective is to provide sufficient liquidity to meet the cash flow requirements of the business at the lowest possible cost to our shareholders. |
|
 |
|
| Figures for the years to 2001 have been restated following the adoption of FRS 19. | |
 |
|
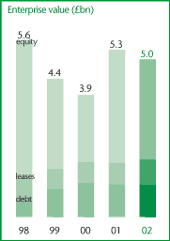
| Enterprise value: Comprises year end market capitalisation and net debt together with the capitalised value of operating leases. | |
 |
|
| Figures for the years to 2001 have been restated following the adoption of FRS 19. | |
 |
|
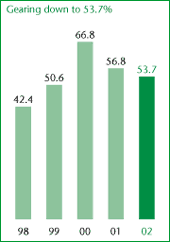
| Gearing: Net debt divided by total capital employed. Figures for the years to 2001 have been restated following the adoption of FRS 19. |
The group used £23 million of cash during the year.
| 2002 £m |
Vs. 2001 £m |
|||
| Earnings | 618 | 38 | ||
| Working capital | (22 | ) | 24 | |
| Capital spend | (366 | ) | (177 | ) |
| Tax paid | (106 | ) | (16 | ) |
| Interest paid | (69 | ) | 8 | |
| Other | 2 | (16 | ) | |
| Cash available to shareholders | 57 | (139 | ) | |
| Dividends paid | (93 | ) | (4 | ) |
| Share issues | 13 | 9 | ||
| Net cash flow | (23 | ) | (134 | ) |
As highlighted above, the group generated £618 million of earnings, which funded, amongst other things, a significant step up in our capital expenditure during the year. Working capital used £22 million of cash in 2002, largely reflecting higher supplier contributions to our promotional programme, not all of which were received by year-end. Tax payments totalled £106 million, interest paid £69 million and dividend payments £93 million, leaving cash flow broadly neutral for the year.
Balance sheet and net debt
With only a small cash outflow for the year, net debt rose slightly to £1,133 million, representing gearing of 54%, down from 57% last year end. Following on from our £111 million generation of cash in 2001,
and reflecting a lower average cost of debt in the year, the net interest charge fell by £12 million to £65 million.
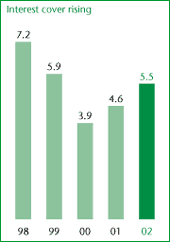
Interest cover (the number of times operating profit is greater than the net interest charge before adjusting for capitalised interest and investment income) strengthened to 5.5 times from 4.6 times last year.
Return on capital employed (post tax) improved by 0.7% to 12.2%.
New accounting standards
The financial statements reflect the introduction of three new accounting standards during the year. The adoption of FRS 19, requiring us to make a full provision for deferred tax on all timing differences, necessitated a restatement of previous years’ figures as this represented a change in accounting policy.
Another new standard is FRS 17, Retirement Benefits, which initially results only in disclosure in the notes of the main financial assumptions made in valuing the liabilities of the group’s pension scheme and the fair value of net assets held. Further disclosure will be included from next year. In line with the transitional provision of FRS 17, the group has continued to account for pensions in accordance with SSAP 24.
Following a review of pension arrangements, the group has announced the closure of its final salary scheme to new members. A new arrangement will be introduced later this year that will still provide defined benefits but on a career average salary basis for new joiners. The group’s pension costs are expected to remain in line with current scheme amounts.
The third new standard, FRS 18, Accounting Policies, replaces SSAP 2, the previous standard on accounting policies, and has had no material impact.
Other financial ratios
| 2002 | 2001 | Increase | |||||
| Safeway sales per sq. ft.
per week |
|||||||
| Total Safeway sales (incl. VAT)/Weighted average sales area | £ | 17.3 | 16.52 | +4.7% | |||
| Sales per full time equivalent
(FTE) Safeway employee |
|||||||
| Total Safeway sales (incl. VAT)/Average number of Safeway FTEs | £K | 159.5 | 151.5 | +5.3% | |||
| Operating margin (excl.
VAT) |
|||||||
| Operating profit/Turnover (excl. VAT) | % | 4.9 | 4.8 | +0.1% | |||
| Operating profit per FTE
Safeway employee |
|||||||
| Safeway operating profit/Average number of Safeway FTEs | £K | 7.2 | 6.8 | +5.9% | |||
| Return on capital employed
(ROCE) |
|||||||
| Profit for the financial year/Average total capital employed | % | 12.2 | 11.5 | +0.7% | |||
| Net tangible assets per
share |
|||||||
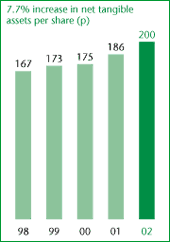
| Net assets/Year end number of shares in issue | pence | 200.3 | 186.8 | +7.7% | |||
| Earnings per share (EPS)
(before property) |
|||||||
| Profit for the financial year/Average number of shares in issue | pence | 24.5 | 22.0 | +11.4% | |||
The future
The successful transition to New Safeway represents the key to our future. I have already highlighted the fact that, as we roll-out more and more stores, we will continue to refine our formats and our offer, building on the experience acquired from earlier refits and ensuring that we do more for less. It remains our policy as a Board only to approve investments which yield returns in excess of our cost of capital, which we continue to manage actively and which fell again in 2002 to 7.1% (from 7.2% last year). Backed by a strong balance sheet we are confident that we are laying strong foundations for New Safeway in the years to come.
| © Copyright 2002. Safeway plc. | Top | Previous | Next |