|
The Group has delivered strong profit growth
during a year in which we have increased investment in our core businesses.
Sales
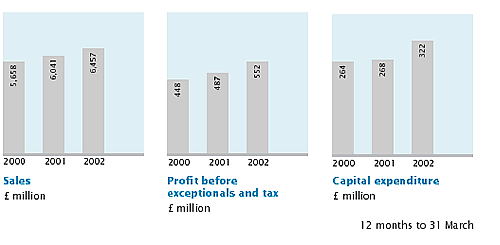
The Group’s turnover grew by 7% from £6,041m to £6,457m, including £42m
from acquisitions. Excluding acquisitions and currency movements, Group
turnover was 6% higher than last year.
Profit
Group profit before amortisation of goodwill and exceptional items increased
by 13% to £552m. Return on sales before exceptional items and goodwill
amortisation rose from 8.1% to 8.6%. The improvement reflects a focus
on our core businesses where profitability has risen, together with the
disposal of other less profitable businesses. The goodwill charge increased
to £127m from £92m largely as a result of an exceptional charge of £27m
relating to impairment of the goodwill associated with Reality Solutions,
the web design business, and with Experian’s credit business in Argentina.
Shareholder return and dividends
Basic earnings per share before goodwill amortisation and exceptional
items were 41.7p in the year ended 31 March 2002 compared to 37.2p last
year. The Board has proposed a final dividend of 15.2p per share, a rise
of 0.4p (2.7%) on last year. The dividend for the year as a whole of 21.7p
is covered 1.9 times from earnings before goodwill amortisation and exceptional
items.
Shareholders’ funds
Shareholders’ funds amount to £2,417m, a reduction of £6m in the
year. This is equivalent to 240p per share compared with 241p last year.
Cash flow and investment in the business
Cash flow before acquisitions, disposals and dividends amounted to £478m
compared to £481m in the previous year. Cash flow benefited from the growth
in profits in the year and from lower working capital levels despite the
growth in the Argos store card loan book. Capital expenditure, however,
grew by £54m to £322m and was equivalent to 152% of the depreciation charge
in 2002.
 |
Group cash flow |
|
|
|
 |
 |
 |
 |
 |
 |
 |
 |
|
2002 |
|
|
|
2001 |
 |
12 months to 31 March |
£m |
|
|
|
£m |
 |
 |
 |
 |
 |
 |
 |
 |
 |
 |
 |
 |
 |
 |
 |
Profit before goodwill,
exceptionals and tax |
552 |
|
|
|
487 |
| |
Exceptional items |
(45) |
|
|
|
(85) |
| |
Corporation tax |
(82) |
|
|
|
(95) |
| |
Change in working capital |
163 |
|
|
|
226 |
| |
Capital expenditure |
(322) |
|
|
|
(268) |
| |
Depreciation |
212 |
|
|
|
216 |
 |
 |
 |
 |
 |
 |
 |
| |
Free cash flow |
478 |
|
|
|
481 |
| |
Dividends |
(213) |
|
|
|
(206) |
| |
Acquisitions and divestments |
(35) |
|
|
|
63 |
 |
 |
 |
 |
 |
 |
 |
| |
Net cash flow |
230 |
|
|
|
338 |
| |
Securitisation repayments |
(380) |
|
|
|
(296) |
| |
Foreign exchange movements |
(4) |
|
|
|
(119) |
 |
 |
 |
 |
 |
 |
 |
| |
Movement in net debt |
(154) |
|
|
|
(77) |
 |
 |
 |
 |
 |
 |
 |
| |
|
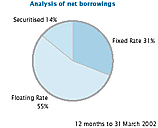
Liquidity and funding
At 31 March 2002, the Group had net borrowings of £1,485m, including securitised
loans of £201m. This shows a reduction of £227m in net borrowings which
were £1,712m at 31 March 2001, including securitised loans of £582m. The
maturity, currency and interest rate profile of the Group’s borrowings
are shown in note 33 to the financial statements.
Treasury and risk management
The Group’s Treasury function seeks to reduce or eliminate the Group’s
exposure to foreign exchange, interest rate and other financial risks,
to ensure sufficient liquidity is available to meet foreseeable needs
and to invest cash assets safely and profitably. It does not operate as
a profit centre and transacts only in relation to underlying business
requirements. It operates policies and procedures which are periodically
reviewed and approved by the Board and is subject to regular Group Internal
Audit reviews.
Interest rate management
The Group’s interest rate exposure is managed by the use of fixed and
floating rate borrowings and by the use of interest rate swaps to adjust
the balance of fixed and floating rate liabilities. The Group also mixes
the duration of its borrowings to smooth the impact of interest rate fluctuations.
Interest expense in the year fell by £4.5m to £66.5m largely because of
the re-financing of a fixed rate US $800m term loan at lower rates in
November 2001, and generally lower interest rates.
Currency risk management
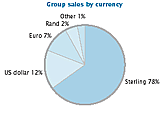
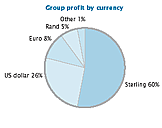
The Group’s reported profit can be significantly affected by currency
movements. Approximately 40% of the Group’s operating profit generated
in the year ended 31 March 2002 was earned in foreign currencies. In order
to reduce the impact of currency fluctuations on the value of investments
in overseas countries, the Group has for some years had a policy of borrowing
in US dollars and euros, as well as in sterling, and entering into forward
foreign exchange contracts in these two currencies. Subsequent to 31 March
2002 the Group has also entered into a forward foreign exchange contract
to sell South African Rand, in order to hedge a proportion of the value
of its investment in its South African retailing business.
Additionally, the Group has a policy of hedging foreign currency denominated
transactions by entering into forward exchange sale and purchase contracts.
Re-organisation costs and savings
The costs of re-organising Argos Retail Group and Reality are shown as
an exceptional item in the profit and loss account, and amounted to £36m
in 2002. The total spend in 2001 and 2002 amounted to £67m. This compares
to our original estimate of £65m. We remain on track to achieve annualised
cost savings of £80m from this re-organisation in the year to 31 March
2003.
Exceptional items
In addition to the re-organisation of the Argos Retail Group and Reality,
we incurred exceptional costs of £8.7m relating to businesses or assets
sold during the year. The (non-cash) charge of £27.5m relating to impairment
of goodwill takes the total exceptional items to £72.6m compared with
£84.7m last year.
Taxation
The Group’s effective tax rate for the year, before goodwill charge and
loss on sale of businesses, has increased from 23.5% to 23.8%. This continues
to be lower than the UK standard corporate tax rate, mainly because of
the corporate reorganisation undertaken in 1998.
Minority interests
Profit attributable to equity minority interests in 2002 of £1.4m relates
to profit attributable to minority shareholdings in companies acquired
by Experian International. Minority interests on the balance sheet represent
the minority share of the net assets of these companies where a small
portion of the equity is held by either external investors or management.
Accounting policies and standards
The principal accounting policies used by the Group are shown in Notes
to the Financial statements - Accounting policies.
The implementation by the Group of Financial Reporting Standards 18 ‘Accounting
Policies’ and 19 ‘Deferred Tax’ has had no material effect on reported
profits. The basis on which interest is reported has been changed in relation
to the Financial Services and Finance Divisions to provide a more appropriate
presentation of their profitability. Financial Services operating profit
is stated after charging £3.0m of funding costs for the Argos store card.
The Finance Division is stated after charging a further £4.4m of funding
costs over and above the interest charge associated with its non-recourse
borrowing. Comparative figures have been restated and the effect is to
reduce both operating profit and net interest by £13.9m in the year ended
31 March 2001. There is no effect on profit before taxation.
The transitional disclosure requirements of FRS 17 ‘Retirement Benefits’
have been adopted in the year, but these have no effect on the primary
financial statements.
Under FRS 17 a snapshot is taken of retirement benefit fund assets and
liabilities at a specific point in time. Thus, movements in equity and
bond markets and in discount rates are expected to create volatility in
the calculation of the scheme assets and liabilities.
The transitional disclosure requirements of FRS 17 require the value of
retirement benefit scheme assets and liabilities to be disclosed. Under
FRS 17 the net retirement benefit liability in the balance sheet at 31
March 2002 would be £17m higher than that provided for in the financial
statements. This should be seen in the context of total retirement benefit
liabilities of over £700m.
» double click on the image to see the enlargement
Share price and total shareholder return
The share price of GUS ranged from a low of 441p to a high of 704p during
the financial year. On 31 March 2002, the mid market price was 700p, giving
a market capitalisation of £7.0bn at that date.
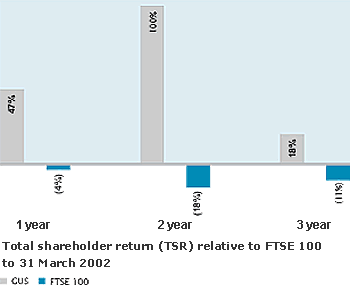
Total shareholder return (the increase in the value of a share including
reinvested dividends) was 47% over the year, with GUS ranked eighth in
the FTSE 100, whose average return was minus 4%.
Post balance sheet event
In April 2002, ConsumerInfo.com was acquired for $130m. It is the leading
supplier of online credit reports, scores and related information to consumers
in the United States.
 
David Tyler
Group Finance Director
|

