


The result for the year is summarised in
Table 1. Financial performance is analysed
between continuing and discontinued
operations. Continuing operations are our
managed underwriting and the supporting
assets. Discontinued operations comprise
the run off results of former participations
on Lloyd’s syndicates managed
by other groups.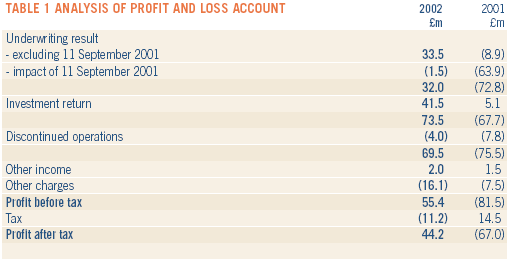 Continuing operations The 2002 performance is significantly better than 2001. The underwriting result improved by £104.8 million to a profit of £32.0 million. Excluding the impact of 11 September losses, the improvement was £42.4 million. Gross premium increased by £127.8 million during 2002 as the business grew into a hardening insurance market. The increase in earned premium amounted to £149.5 million or 44%, coming from a combination of organic growth and our increased ownership of syndicate 2001 over the past few years. Performance was strong for all of our ongoing businesses, although this was partially offset by a strengthening of reserves for ceased syndicate 1141. Assuming 100% ownership, our overall combined ratio improved from 117% to 95% or 100% to 93% excluding 11 September losses. For syndicate 2001, our ongoing business, the combined ratio for 2002 was 91%. Its performance is analysed in Table 2 which also illustrates the scale of our overall underwriting operations. If Amlin had owned 100% of its managed syndicates over the last three years, our 2002 underwriting result, before investment return, for 2002 would have been £39.8m. The Group has been progressively increasing its share of syndicate 2001 in recent years, culminating in the acquisition of the right to underwrite 100% of the syndicate in the future. 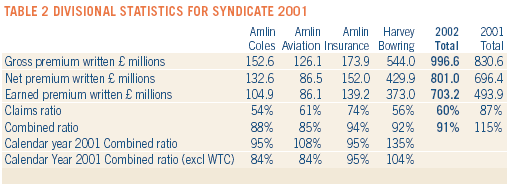 Divisional analysis The following divisional analysis provides comparison as if we owned 100% of the business. This provides an analysis which is therefore not distorted by our changing levels of syndicate ownership. Divisional performance is measured against 2001 without the 11 September losses as this provides a truer comparison of underlying change. Harvey Bowring improved its combined ratio to 92% from 104%. The division was a beneficiary of significant rate improvements in its reinsurance and property accounts on which it has experienced low levels of losses. Amlin Aviation delivered an impressive combined ratio of 85% compared with 84% in 2001. The division benefited from strong price increases in the main airline renewal season in the fourth quarter of 2001. Much of this premium has been earned in 2002. Except for the events of 11 September 2001, the level of loss incidence during 2001 and 2002 has been extremely low, enhancing returns in both years. Coles has continued to produce strong results despite the transfer of the highly profitable excess of loss reinsurance account into Harvey Bowring in 2001, and only slowly improving marine market conditions. The combined ratio of the division was 88% compared with 84% in 2001. The division has expanded its underwriting during 2002 with premium written increasing to £152.6 million (2001: £118.8 million). Much of the expansion was in the energy account, which was the first marine account to attract good price increases, and the war account which saw dramatic increases following the 11 September losses. Amlin Insurance Services’ combined ratio improved to 94% from 95%. This level of ratio has been sustained as a result of strong rate improvements witnessed in the last three years in its commercial motor account and good performance from the UK liability accounts, which were expanded during 2002. A cautious approach to reserving has been adopted for the professional indemnity and employers’ liability accounts but developments to date have been encouraging. Recognition of underwriting profits Our accounting policies lead to a delay in recognising, in our consolidated figures, improvements in the underlying profitability of the business. This is best illustrated by looking at the earning profile of business written in a calendar year. At 31 December 2001 we reported that for business written in 2001 only 39% of net premium was earned. During the year ended 31 December 2002, a further 54% of this 2001 income has been earned. However, only 40% of net premium written in 2002 has been earned in 2002. We would expect a similar pattern to emerge during 2003. Growth in syndicate ownership The final crucial factors which support our view of Amlin’s earnings profile are the growth of our ownership of syndicate 2001 into these improving conditions and how we have supported that growth. The dramatic increase in ownership is illustrated in Table 4, culminating in the acquisition of the balance of the syndicate for 2004 and onwards. We have supported some of this growth through debt and the leverage has increased as conditions have improved. This should enhance an already good earnings trend. 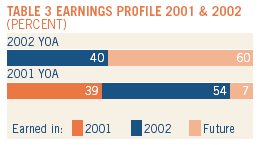 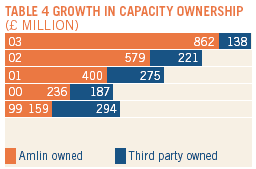
Investment performance The decision to sell our equity holdings in September 2001 has proven to be beneficial. Our overall investment return for 2002 of 7.2% (2001: 1.3%) was a welcome contributor to profit, in what have proven to be difficult investment markets during the year. By comparison the FTSE 100 index fell 24.5% during 2002. Our share of the syndicate investment portfolio grew again to £535.3 million (2001: £304.8 million) resulting from strong cash flow and increased syndicate ownership. Syndicate funds are mainly invested in bonds with an average benchmark duration of two to three years. These produced an above average return of 7.3%. Due to the anticipated volatility and uncertain cash flows relating to the 11 September losses, an average $164 million of syndicate funds were invested against a cash benchmark. These yielded a much lower return of 1.7%. Our corporate assets, which totalled £227 million at the year end, were invested in bonds and cash funds. The bond portfolio was a longer duration portfolio than in the syndicates, with an average duration of seven years and produced a return of 8.2%. Cash funds yielded 4.0%. Our cash holdings, of £102.4 million at the year end, have been greater than we would normally expect reflecting a defensive asset allocation. This is driven by the high opportunity cost of investment losses, measured by the potential underwriting return achievable off the capital base. 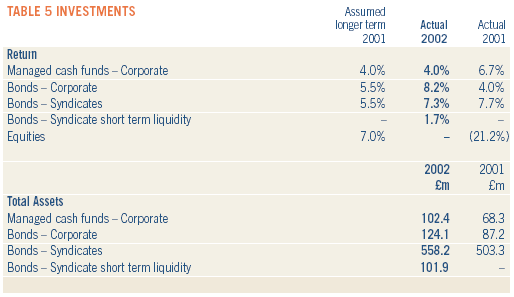
In reviewing asset allocation we have remained concerned over valuations and volatility in investment markets. We chose during 2002 not to re-invest in equities as stock markets continued to be volatile, with increasing economic and political uncertainty. Equally, with bond yields approaching levels not seen in decades and monetary policy already appearing relatively lax in the UK, our expectations of bond returns were closely matched by cash returns. The asset mix within our bond portfolios has also continued to be defensive. A breakdown of the syndicate and corporate portfolios is included in Table 6. This demonstrates that the overall credit rating of bond holdings held is high. 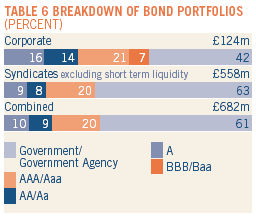
Expenses(excluding brokerage) Expenses have increased by £17.6 million during the year, comprising a £9.0 million increase in Amlin’s share of syndicate operating expenses to £41.1 million and an £8.6 million increase in other corporate charges to £16.1 million. At syndicate level this is due largely to the increase in Lloyd’s costs which are based on capacity. Additionally, as we explained last year Lloyd’s increased the Central Fund premium levy for 2002 and 2003 by an extra 2%. This added an extra £12.3 million to the syndicate cost base in 2002, which equates to £8.7 million to Amlin plc. This will be repeated in 2003 but it is expected that it will be removed next year. Other Lloyd’s charges have risen with the increase in the business written. 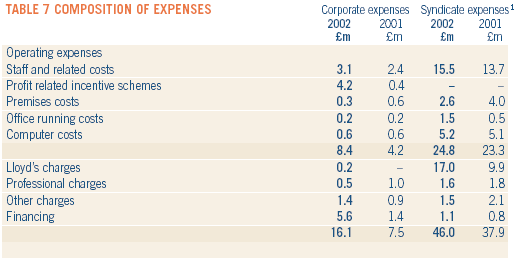 ¹ Syndicate expenses are shown at 100% syndicate level and exclude personal expenses and acquisition costs £3.8 million of the increase in corporate expenses relates to accrued incentive and bonus plan payments, of which £2.5 million relates to the capital builder plan which is based on underwriting returns exceeding 5 year performance targets. £4.2 million of the increase is financing costs in respect of additional borrowing facilities taken on in 2002 to support our underwriting. Balance sheet The consolidated balance sheet aggregates the group’s own assets and its shares of syndicate assets. Table 8 provides a simplified corporate balance sheet including all syndicate interests as a single line. 
The balance sheet has been strengthened by the issue of £123 million of share capital, retained profit of £36.6 million and increases to our prior period claims reserves of £20 million. The level of uncertainty relating to 11 September losses has also reduced during the year. Overall, after exchange adjustments, the impact in 2002 of changes to our loss estimates has been small. Our estimate peaked in the first half of 2002 and is now beginning to reduce as losses begin to settle. The share capital increase was through two separate issues. In February 2002 we completed a 2 for 7 rights issue with proceeds of £43 million being utilised to support our 2002 underwriting. In July 2002 we raised a further £80 million through a share placing and open offer. The proceeds of this issue were used to finance the acquisition of our syndicate capacity and to help support our enlarged capacity for 2003. The consideration for our capacity acquisition comprised shares to the value of £13 million and cash of £32.2 million. This is reflected in increased intangible assets of £46.0 million. Syndicate cash flow has been strong and this has been a focus of operational management. The increase in total syndicate cash and investments amounted to £200 million for the year to 31 December 2002, reflecting strong premium flow and low claims incidence. Efforts have been made to collect our premium faster over the last two years with terms of trade being tightened and the level of overdue debt substantially reduced due to more effective credit control. Reinsurance is an essential risk management tool within our business. However, reinsurance debt is itself open to credit risk which needs close management. We attempt to place reinsurance with companies that we believe are strong. We assess the financial strength, trading record, outlook and organisational structures as part of this process, as well as looking at credit ratings. Due to concerns about the reinsurance market in general we have placed our programmes with increasingly high grade security for 2002 and 2003. An analysis of the 2003 reinsurance programme security and our debt exposures is provided in Table 9. 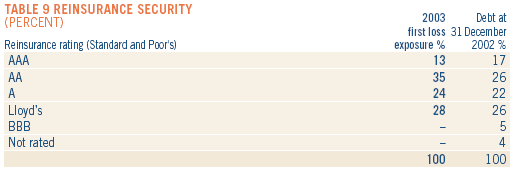
We have made good progress in collecting reinsurance receivables, a significant part of which relate to 11 September losses. During the year we collected over £150 million from reinsurance debtors in respect of this loss, much of it in advance of, or simultaneously with, the claims settlement. The grade of security for remaining debt in respect of this loss is set out in Note 3 to the accounts. This demonstrates that 92% of debt is with ‘A’ rated security or better, even after the downgrades to credit ratings in 2002. Regulatory capital Lloyd’s operate a regime which sets the capital requirements, or Funds at Lloyd’s, for our syndicate operations. Broadly two components combine to make up our Funds at Lloyd’s. First risk based capital is provided based on our syndicate capacity and risk based capital ratios set by Lloyd’s. Our current ratio is 40%, the minimum level allowed. The second element is a loading for solvency on open years. The sources of our Funds at Lloyd’s supporting the 2002 and 2003 years of account are summarised in Table 10. 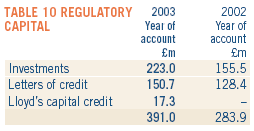
Letters of credit have been provided by State Farm, a major shareholder in Amlin, and a syndicate of banks. The use of leverage allows Amlin to quickly support its underwriting in a hard market without unnecessarily diluting shareholders. As the cycle turns we expect to reduce our level of gearing with the intention of removing all borrowing by the time that underwriting margins become thin. Discontinued operations The Group’s direct holdings in non-aligned syndicates were sold in 1999 and the indirect holdings through its investment in Stace Barr Angerstein PLC (‘SBA’) ceased after the 2000 year of account. The discontinued result comprises losses of £1.6 million on the direct holdings and an estimated £1 million loss for SBA. In view of the deterioration from these participations an increased provision of £1.9 million has been carried forward at 31 December 2002 to cater for future deterioration on syndicates that remain in run off. 
RICHARD HEXTALL FINANCE DIRECTOR |
||