| Ten year financial summary |
|
|
|
|
|
|
|
|
|
|
| 92/93 | 93/94 | 94/95 | 95/96 | 96/97 | 97/98 | 98/99 | 99/00 | 00/01 | 01/02 | |
| Turnover | 116,145 | 135,318 | 153,739 | 173,652 | 200,140 | 213,777 | 217,758 | 233,485 | 268,322 | 267,597 |
| Overseas sales | 59,808 | 74,976 | 90,045 | 104,432 | 119,235 | 126,863 | 134,189 | 150,727 | 181,831 | 183,259 |
| Profit before taxation, goodwill amortisation and exceptional items | 20,891 | 25,075 | 29,234 | 33,619 | 37,076 | 42,391 | 41,823 | 43,751 | 49,698 | 48,255 |
| Net tangible assets (Note 1) | 46,064 | 55,518 | 63,833 | 77,650 | 81,209 | 98,249 | 102,101 | 89,755 | 99,991 | 117,515 |
| Borrowings | 8,726 | 6,898 | 7,096 | 8,350 | 3,763 | 2,784 | 7,730 | 14,700 | 7,758 | 15,047 |
| Cash and short-term deposits | 17,248 | 16,794 | 19,759 | 27,459 | 13,447 | 22,639 | 29,894 | 21,900 | 21,484 | 45,657 |
| Employees | 1,902 | 2,099 | 2,226 | 2,384 | 2,677 | 2,861 | 2,827 | 2,975 | 3,059 | 2,895 |
| Earnings per ordinary share (Notes 1,2 and 3) | 4.19p | 4.79p | 5.59p | 6.44p | 7.01p | 6.87p | 7.91p | 6.08p | 8.91p | 8.58p |
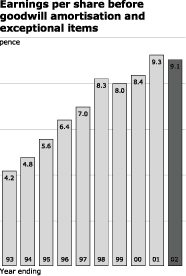
| Earnings per ordinary share before goodwill amortisation and exceptional items (Notes 1 and 2) | 4.19p | 4.79p | 5.59p | 6.44p | 7.01p | 8.26p | 7.99p | 8.41p | 9.34p | 9.10p |
| Year on year increase/(decrease) in earnings per ordinary share before goodwill amortisation and exceptional items | 28.9% | 14.3% | 16.7% | 15.2% | 8.9% | 17.8% | (3.3%) | 5.3% | 11.1% | (2.6%) |
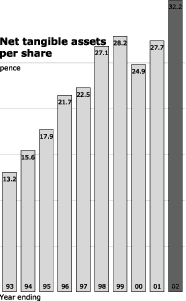
| Net tangible assets per ordinary share (Notes 1 and 2) | 13.2p | 15.6p | 17.9p | 21.7p | 22.5p | 27.1p | 28.2p | 24.9p | 27.7p | 32.2p |
| Year on year increase/(decrease) in net tangible assets per ordinary share | 17.9% | 18.2% | 14.7% | 21.2% | 3.7% | 20.4% | 4.1% | (11.7%) | 11.2% | 16.2% |
| Profit before taxation, goodwill amortisation and exceptional items as a % of turnover | 18.0% | 18.5% | 19.0% | 19.4% | 18.5% | 19.8% | 19.2% | 18.7% | 18.5% | 18.0% |
| Return on capital employed (Note 4) | 45.4% | 45.2% | 45.8% | 43.3% | 45.7% | 43.1% | 41.0% | 48.7% | 49.7% | 41.1% |
| Year on year increase in dividends per ordinary share | 20% | 20% | 20% | 20% | 20% | 20% | 20% | 20% | 15% | 15% |
| Ordinary share price at financial year end (Note 2) | 108p | 127p | 113p | 138p | 134p | 124p | 92p | 95p | 129p | 164p |
| Market capitalisation at financial year end | £375.2m | £446.9m | £401.5m | £492.1m | £479.2m | £447.3m | £330.6m | £340.1m | £465.7m | £598.2m |


Notes:
- Figures for 2000/01 have been restated to reflect the change in accounting policy relating to deferred tax following the adoption of FRS19 in 2001/02. Earlier figures have not been restated.
- Restated for the capitalisation issues made in 1993, 1995 and 1997.
- Earnings per ordinary share figures have been restated where appropriate on an FRS3 basis for items previously disclosed as extraordinary.
- Return on capital employed is defined as profit before taxation, goodwill amortisation and exceptional items expressed
as a % of net tangible assets.