| International Power delivered strong financial performance during 2001. Profit before interest and tax (PBIT), excluding exceptional items, was up 48% to �326 million from �221 million in 2000. Earnings per share (basic) were up 75% to 12.8p from 7.3p in 2000. Operating cash flow increased to �333 million compared to �11 million for the prior nine-month period. Key performance drivers underlying these strong results in 2001 include the addition of new operating capacity in the US at our new plants in Massachusetts and Texas and the operation of those units during the summer peak demand period. Also, the excellent operating performance of our power plants in all regions resulted in profit improvements in each of our key markets. 
 | | Results - excluding exceptional items (continuing business only) | | | | | Year ended | | Nine months ended | | | | | | 31 December | | 31 December | | 31 December | | 31 December | | Year ended | | | | | 2001 | | 2000 | | 2000 | | 1999 | | 31 March | | | | | | (proforma) | | | | (proforma) | | 2000 | | | | �m | | �m | | �m | | �m | | �m | | | | | Turnover - gross | | 1,103 | | 1,002 | | 762 | | 705 | | 1,021 | |
| | Profit before interest and tax | | 326 | | 221 | | 167 | | 137 | | 191 | | | Interest | | (123) | | (104) | | (81) | | (73) | | (96) | | | Tax | | (58) | | (29) | | (21) | | (50) | | (58) | | | Minority interests | | (2) | | (6) | | (4) | | 1 | | (1) | |
| | | 143 | | 82 | | 61 | | 15 | | 36 | |
| | Earnings per share | | 12.8p | | 7.3p | | 5.5p | | 1.2p | | 3.0p | |
| | The proforma results for the year to 31 December 2000 are unaudited and have been derived by aggregating the results for the nine months ended 31 December 2000 and the management accounts for the three months to 31 March 2000, and making proforma adjustments to interest and tax to reflect the post-demerger capital structure. | | The proforma results for the nine months ended 31 December 1999 are unaudited. | |
This report reviews our results of operations on a regional basis to provide an understanding of the key factors impacting our historical trading performance. The results for each period, both 2001 and 2000, are compared primarily with the results for the corresponding comparative period. Our results are prepared in accordance with UK Generally Accepted Accounting Principles (GAAP). As announced at the time of presenting our Q3 results, we redefined our business segments with effect from 31 December 2001 to better represent how we manage the business. For clarity, our results are presented in this new format.

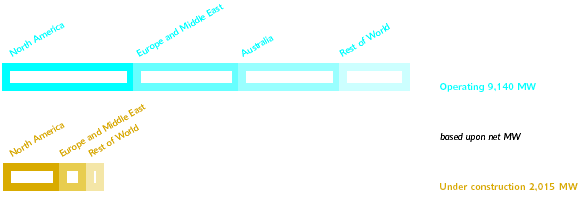
The table below sets out details in relation to our operating power plants and plants under construction
as at 18 March 2002. | | | | Plant | | Type | | Gross capacity
MW power | | Gross capacity
MW heat | | Net capacity (2)
MW power | | Net capacity (2)
MW heat | | | | | North America | | Hartwell, Georgia, US | | OCGT | | 310 | | | | 155 | | | | | Oyster Creek, Texas, US | | Cogen/CCGT | | 425 | | 60 | | 210 | | 30 | | | Milford, Massachusetts, US | | CCGT | | 160 | | | | 160 | | | | | Midlothian I & II, Texas, US | | CCGT | | 1,650 | | | | 1,650 | | | | | Blackstone, Massachusetts, US | | CCGT | | 570 | | | | 570 | | | | | Hays (unit I), Texas, US | | CCGT | | 275 | | | | 275 | | | | | Europe and Middle East | | EOP, Czech Republic (1) | | Steam | | 540 | | 2,000 | | 535 | | 1,920 | | | Deeside, UK | | CCGT | | 500 | | | | 500 | | | | | Rugeley, UK | | Steam | | 1,000 | | | | 1,000 | | | | | Elcogas, Spain | | IGCC | | 335 | | | | 15 | | | | | Pego, Portugal | | Steam | | 600 | | | | 270 | | | | | Marmara, Turkey | | CCGT | | 480 | | | | 160 | | | | | Australia | | Hazelwood, Victoria, Australia | | Steam | | 1,600 | | | | 1,470 | | | | | Synergen, South Australia, Australia | | Various | | 360 | | | | 360 | | | | | Pelican Point, South Australia, Australia | | CCGT | | 485 | | | | 485 | | | | | Rest of World | | HUBCO, Pakistan | | Steam | | 1,290 | | | | 330 | | | | | KAPCO, Pakistan | | CCGT | | 1,600 | | | | 575 | | | | | Malakoff, Malaysia (1) | | Various | | 1,495 | | | | 290 | | | | | Shijiazhuang Yong Tai, PRC | | Cogen | | 15 | | 90 | | 10 | | 65 | | | Yihua, PRC | | Cogen | | 40 | | 75 | | 10 | | 10 | | | Pluak Daeng, Thailand | | Cogen | | 110 | | 20 | | 110 | | 20 | |
| | TOTAL operating | | | | 13,840 | | 2,245 | | 9,140 | | 2,045 | |
| | | | Under construction | | North America | | Hays, Texas (units II, III, IV), US | | CCGT | | 825 | | | | 825 | | | | | Bellingham, Massachusetts, US | | CCGT | | 570 | | | | 570 | | | | | Europe and Middle East | | Shuweihat S1, UAE | | CCGT | | 1,500 | | | | 300 | | | | | Al Kamil, Oman | | CCGT | | 280 | | | | 280 | | | | | Rest of World | | Malakoff Lumut, Malaysia | | CCGT | | 210 | | | | 40 | | | |
| | TOTAL under construction | | | | 3,385 | | | | 2,015 | | | |
| | (1) Gross capacity amount shown for EOP and Malakoff represents the actual net capacity owned directly or indirectly by EOP and Malakoff, respectively. | | (2) Net capacity - Group share of gross capacity. |
North America consists of plants in Georgia, Massachusetts and Texas, which had a maximum net generating capacity of 3,019 MW in 2001. We will complete our current construction programme in Massachusetts and Texas in 2002, bringing our total net installed capacity in North America to 4,400 MW. In addition, we have projects under development in New York totalling 1,650 MW. We also conduct energy trading activities that are principally focused on selling the physical output of our plants. However, we also perform limited proprietary trading that is subject to clear risk limits. Gross turnover in North America increased by 58% from �150 million in 2000 to �237 million in 2001. Our share of turnover from joint ventures during the year ended 31 December 2001 was �77 million (32% of the region's total gross turnover), an increase of 3% as compared to the year ended 31 December 2000. 2001 was an important transition year for our North American business as we brought into operation a significant amount of new capacity in Massachusetts and Texas. The increase in gross turnover principally reflects this increase in generating capacity - maximum capacity of 3,019 MW in 2001 compares with 1,074 MW in 2000. Our North American proprietary trading business contributed �4 million to PBIT during the year ended 31 December 2001. For the 2001 period, we entered into forward sales and purchase contracts to shield us from adverse price fluctuations. Consequently, our plants in Massachusetts (NEPOOL) and Texas (ERCOT) achieved spreads (the difference between the selling price of power plus ancillary services and the cost of fuel) considerably higher than the spot market. For the component of our output that is not forward contracted, we remain exposed to fluctuations in market prices. To the extent that our output is not forward contracted, we remain exposed to fluctuations in market price. However, we are able to utilise the peak load flexibility of our new plants to take advantage of favourable price opportunities as they arise. We also use our trading and marketing expertise to maximise the revenue from ancillary services available in the markets where we operate. During the 12-month period ended 31 December 2001, we recorded other operating income of �80 million relating to the late commissioning and performance recovery of our new power plants (�28 million in 2000). This compensation for loss of income is receivable from Alstom, who is both the manufacturer of the gas turbines and the principal contractor for the construction of our new North American plants. The commercial and technical arrangements that support Alstom's completion of our North American plants, and the performance recovery programme for the GT 24B gas turbines, both continue to meet expectations. Alstom has demonstrated technical progress and continued to meet its commercial responsibilities. Operating profit increased by 116% from �43 million to �93 million. The increase in operating profit primarily reflects the increased turnover of our North American operations, together with the impact of compensation for the late commissioning and performance recovery of our new plants. We will complete our current construction programme in Massachusetts and Texas in 2002, bringing our total net installed capacity in North America to 4,400 MW. In addition, we have projects under development in New York totalling 1,650 MW. Operating costs consist of both fixed operating costs, such as depreciation, payroll and property taxes, and variable operating costs, such as fuel costs. Our fixed cost base increased in line with the completion of the construction programme and variable costs tracked our profile of physical output. Where appropriate, we seek to minimise the impact of fluctuations in fuel supply cost by locking in our fuel supply at the same time that we sell our ouput. 
Europe and Middle East consists of two plants in the UK together with our plants in the Czech Republic, Portugal and Turkey. In addition, we have a plant under construction in Oman and projects under development in Italy and Abu Dhabi. In July 2001, we completed two significant transactions that rebalanced our European portfolio, increased the installed capacity under our direct control and reduced our minority position in legacy assets. Specifically, we sold back our 25% equity ownership in UFG (Spain) to Union Electrica Fenosa and acquired the 1,000 MW coal-fired Rugeley plant in the UK. Our total installed capacity in this region at 31 December 2001 was 2,477 MW, as compared to 2,810 MW at 31 December 2000, and the capacity that we now control and operate in Europe and Middle East increased from 1,497 MW to 2,464 MW. When the plants in Oman and Abu Dhabi are completed in 2002 and 2004 respectively, our net installed capacity will be 3,057 MW. Gross turnover in Europe and Middle East decreased by 2% from �534 million in the year ended 31 December 2000 to �521 million in the year ended 31 December 2001. The decrease principally relates to the sale of our interest in UFG, partially offset by the acquisition of Rugeley. Turnover from joint ventures and associates in the region during 2001 was �351 million (67% of the region's gross turnover), a decrease of 6% as compared to 2000, again reflecting the sale of UFG. Operating profit, excluding exceptional items, increased by 10% from �128 million in the year ended 31 December 2000 to �141 million for the year ended 31 December 2001. The increase in operating profit reflects our share of the profitability of UFG prior to its sale in July 2001 and the contribution from Rugeley since its acquisition, also in July 2001. In Europe and Middle East, all of our output in 2001 was subject to either long-term power purchase agreements, tolling agreements or shorter term forward sales contracts. In the UK, we have a tolling agreement for Rugeley until the end of 2005, but our forward sales contract for Deeside (500 MW) terminates in March 2002. We are looking to forward sell output from Deeside, where appropriate, but lower UK wholesale prices mean that this plant will be more exposed to fluctuations in market prices. In the Middle East, our Al Kamil plant (285 MW) under construction in Oman and our Shuweihat S1 power and desalination plant (1,500 MW gross; 300 MW net; 100 million imperial gallons per day) under construction in Abu Dhabi are both subject to long-term power purchase and off-take agreements. Our Italian greenfield development programme continues to move forward in partnership with Ansaldo Energia. Three of the projects - Alessandria (1,600 MW), Montecchio Maggiore (800 MW) and Offlaga (1,600 MW) - are now under formal review by the Ministry of Industry. Within the next few months, we expect to submit applications for an additional three projects. Recently, we increased our ownership stake in eight of the nine projects to 75.5% (our equity stake in Offlaga remains 49%), while Ansaldo continues to hold the other 24.5% position in the eight projects.
Australia consists of one plant in Victoria (Hazelwood), one plant in South Austrialia (Pelican Point) and the Synergen peaking units, also located in South Australia. We also conduct energy trading activities and, in line with our business in North America, these are principally focused on selling the physical output of our plants. However, we also perform limited proprietary trading, which again is subject to clear risk limits. Turnover in Australia increased by 46% from �133 million to �194 million. We do not have any joint ventures and associates in Australia. This increase principally reflects improved electricity prices in Victoria - since Q3 2000 both spot and forward prices in Victoria improved significantly, allowing the forward contracting of power at improved margins. The average price secured in Australia in 2001 was approximately A$40 per MWh, as compared to A$35 per MWh in 2000. In addition, turnover increased as a result of our Pelican Point plant in South Australia commencing combined cycle commercial operation in March 2001. Our megawatts in operation in Australia increased from 1,828 MW at the end 2000 to 2,315 MW at 31 December 2001, an increase of 27%. Operating profit increased by 36% from �53 million to �72 million. Margins in Victoria benefited from the combined effects of improved wholesale electricity prices and our ownership of Hazelwood's fuel supply, an open pit lignite mine located adjacent to the plant. Pelican Point was successfully commissioned on time and also contributed to this improvement in operating profit. Development of the 680 km SEA Gas pipeline project, in which we have a 50% interest, continues to move forward. We have obtained the pipeline licence in South Australia and Indigenous Land Use Agreement in Victoria. The total project is estimated to cost �90 million, and will provide us with a reliable fuel supply, incremental revenue and significant cost savings.
The Rest of World consists principally of plants in Pakistan, Malaysia and Thailand, representing a total net capacity of 1,340 MW. In addition, the capacity of our existing plant in Malaysia is being increased by 50% (a net MW increase of 125 MW). Gross turnover from assets located outside our three core regions decreased by 18% from �185 million to �151 million. Our share of turnover from associates in this category during the year ended 31 December 2001 was �118 million, a decrease of 26% as compared to the year ended 31 December 2000. The decrease in gross turnover from generation principally reflects the sale of the majority of the Chinese operations, as well as the effect of changing the accounting treatment for our investments in Karaganda (Kazakhstan) and Kot Addu (Pakistan) from the equity method of accounting to trade investments as at 1 April 2000. Following the resolution of the long running tariff dispute with WAPDA, in November 2001 we received from the Hub Power Company in Pakistan (HUBCO, of which we own 26%) a �5 million interim dividend payment relating to their year ended 30 June 2001. This interim dividend was the first to be paid to HUBCO shareholders in over three and a half years. In January 2002 we received �7 million relating to the final dividend for 2001, and in February 2002, HUBCO declared an interim dividend for their financial year ended 30 June 2002 - our share is approximately �12 million and receipt of this is anticipated in Q2 2002. We have long-term power purchase agreements for each of our plants in this region and therefore financial performance will not be subject to fluctuations in energy prices. In common with most power purchase agreements, availability is the key factor in determining profitability and all our plants continue to maintain excellent standards. Operating profit, excluding exceptional items, increased by 20% from �40 million to �48 million. This increase in operating profit reflects a full year contribution from our Thailand plant that was commissioned in 2000 and from our interest in HUBCO, now that WAPDA are paying their receivables in line with the previously disclosed settlement agreement. With respect to our other asset in Pakistan, the Kot Addu Power Company (KAPCO; of which we own 36%), the principal terms for implementing the settlement agreement have been agreed and a formal signing is expected soon. This should enable the subsequent declaration and payment of dividends.
Gross turnover in North America increased 130% from �50 million to �115 million. Our share of turnover of joint ventures during the nine-month period ended 31 December 2000 was �63 million (55% of gross turnover), an increase of 34% as compared to the same period in 1999. The increase in gross turnover principally reflects the commencement of commercial operations of one new Midlothian plant in Texas. Operating profit, excluding exceptional items, increased by 48% from �23 million to �34 million, reflecting increased turnover; operating profit also includes �28 million of payments in respect of compensation for lost output due to the late commissioning of power plants. Operating costs consist of fixed operating costs, such as depreciation and payroll, and variable operating costs, such as fuel supply. Depreciation increased during the period as a result of new construction. During 1999, we disposed of our equity investments in the Mecklenburg and Hopewell facilities. These disposals resulted in a total gain of �9 million, which was recorded as operating income, which offset operating costs for the period.
Gross turnover in Europe and Middle East increased by 21% from �336 million to �405 million. The increase in gross turnover relates principally to the acquisition of a 25% interest in UFG on 30 June 1999 and the commencement of operations at the Marmara facility in Turkey in June 1999. Operating profit, excluding exceptional items, increased 17% from �75 million to �88 million. The increase in operating profit reflects a full nine-month contribution from UFG and Marmara and also improved performance at our Deeside facility in the UK, which benefited from the off-take and fuel supply contract negotiated prior to demerger.
Gross turnover in Australia remained relatively stable, decreasing from �107 million to �106 million. Operating profit, excluding exceptional items, decreased 4% from �48 million to �46 million. The results for 2000 reflect a first-time contribution from our Synergen plant, which we acquired in May 2000. This increase in contribution was offset by a small decline in contribution from Hazelwood due to slightly increased outage costs in 2000.
Gross turnover in Rest of World decreased 36% from �212 million to �136 million. Our share of turnover from joint ventures and associates during the nine months to 31 December 2000 was �111 million, a decrease of 26% as compared to the nine months to 31 December 1999. The decrease in gross turnover from generation principally reflects the effect of the change of accounting treatment with respect to our investments in Karaganda (Kazakhstan) and Kot Addu (Pakistan) from the equity method of accounting to trade investments as at 1 April 2000. Operating profit, excluding exceptional items, increased 74% from �19 million to �33 million. The increase in segmental operating profit reflects the increased contribution from our Thailand plant and our interest in HUBCO.
Following the consolidation of our corporate office in London and the increased management focus on cost control, corporate costs decreased by �15 million from �43 million for the year ended 31 December 2000 to �28 million for the year ended 31 December 2001, a reduction of 35%. Corporate costs include not only corporate functions but also business support costs for our operations worldwide. The Group accounts for the year ended 31 December 2001 include five exceptional items - an �8 million credit arising from the release of an onerous property lease provision; a �10 million charge in respect of a guarantee given for Elcogas (Spain); a �2 million release of the provision for the exit costs from China; and a �30 million gain on the sale of our 25% stake in UFG. The first two items (net charge of �2 million) are reported as operating exceptionals, and the latter two (net credit of �32 million) are reported as non-operating exceptionals. The Group accounts also include an exceptional interest charge of �29 million in 2001 (relating to the refinancing at Hazelwood, Australia), which is described in more detail in net interest. In the nine months ended 31 December 2000, three exceptional charges were recorded - �49 million relating to costs arising out of the demerger of Innogy, �25 million of reorganisation costs relating to the restructuring following demerger and a provision of �25 million to cover exit costs from the Chinese market. In the year ended 31 March 2000, a number of the overseas assets were impaired by an aggregate of �246 million as a result of the commercial circumstances in their respective markets. The impairment principally arose in Pakistan and Australia. Additionally, the Group recorded initial provisions of �4 million, �14 million and �35 million in relation to reorganisation costs, demerger costs and gas swaps and hedges, respectively.

Net interest payable for the year to 31 December 2001 was �123 million, before exceptional items. Corporate and subsidiary operations accounted for interest payable of �76 million, comprising primarily of gross interest of �123 million on bonds, bank loans and overdrafts, offset by �24 million interest receivable and by capitalised interest of �23 million. Joint ventures and associates had a net interest payable of �47 million. Consolidated interest cover was 2.7 times (2.4 times excluding interest capitalised). All banking and credit rating covenants were comfortably met with significant margins. Included in exceptional items for the year ended 31 December 2001 is an interest charge of �29 million. This represents the cost of cancelling the existing interest rate swaps and capitalised arrangement fees following the successful refinancing of the non-recourse debt facility for the Hazelwood power plant in Victoria, Australia. This refinancing reduces our interest cost, extends the average maturity of the debt and allows the release of cash to the parent company. Amounts reported for Group interest in the period to 30 September 2000 allocated net interest payable between Innogy and International Power on the basis that the debt assumed by each party at demerger was attributed to that party over all periods presented, or since the debt arose. Consequently, net interest charges for that period do not necessarily reflect our capital structure as it would have been had we operated as an independent entity during the period.
The tax charge for the year was �58 million compared with �21 million for the nine months ended 31 December 2000. The tax charge represents an effective tax rate of 28%, compared to 24% in the prior period. The Group has continued to benefit from the utilisation of tax losses and the availability of certain overseas tax concessions. These concessions are expected to expire in the medium-term. The allocation of the tax liabilities of National Power in the period to 30 September 2000 between the ongoing operations and those subsequently demerged was calculated as if Innogy operated on a stand-alone basis, with the balance of tax charges allocated to International Power. Consequently, tax charges do not necessarily reflect the business or results of operations of International Power as they would have been had we operated as an independent entity during the period.
In the near-term, we continue to face weak prices in selected wholesale markets, principally Texas and the UK. The price environment continues to be driven by concerns on the economy, cyclical supply/demand imbalances and by recent mild weather patterns, rather than by the fundamental economics of owning and operating modern efficient power generation. These prevailing market conditions should improve as a result of the enhanced prospect for economic recovery and the substantial contraction in project development and new construction activity. Steps taken in the past year have resulted in a usefully strengthened balance sheet relative to our peer group, a significant increase in our cash flow and ready liquidity to take advantage of the many opportunities currently available in the marketplace. In this environment, International Power has good prospects for continued growth and the creation of additional value for shareholders.
As announced within our Q3 2001 results, we redefined our business segments with effect from 31 December 2001 to reflect: - our strategic focus on three principal markets: North America, Europe and Middle East, and Australia;
- a more coherent geographic grouping of our power portfolio;
- the fact that each of our proposed segments tend to share common characteristics, including their political risk profile, currency risk profiles and competitive environment. The table below sets out a side-by-side comparison of our previous and new business segments:
| Previous business segments | New business segments | | North America | North America | | Central and Northern Europe | Europe and Middle East | | Western Mediterranean | Europe and Middle East | | Eastern Mediterranean | | | Turkey | Europe and Middle East | | Middle East | Europe and Middle East | | Pakistan | Rest of World | | Asia | Rest of World | | Australia | Australia |
The key accounting policies are summarised below. There are no entities that have not been properly included in the consolidated accounts, and no sale and leaseback (or similar) transactions that could have the effect of transferring debt off the balance sheet. Income recognition Turnover, from plants subject to power purchase agreements (PPAs), is recognised in accordance with the contract terms. Turnover from merchant plants is recognised as output delivered, after taking account of related hedging contracts. Liquidated damages (LDs), principally in respect of late commissioning, are currently included in other operating income. These LDs are, in substance, intended to replace the income that would otherwise have been earned. Proprietary trading income is recognised on the basis of completed contracts and the mark-to-market values of outstanding contracts at the period end.  Tangible fixed assets Tangible fixed assets The original cost of greenfield assets includes relevant borrowing and development costs: - Interest on borrowings relating to major capital projects with long periods of development is capitalised during their construction and written-off as part of the total cost over the useful life of the asset.
- Project development costs (including appropriate direct internal costs) are capitalised from the point that the Board confirms that it is reasonably certain that the project will proceed to completion.
Depreciation of plant is charged so as to write down the assets to their residual value over their estimated useful lives: - Following a recent review of secondary market values, gas turbines and related equipment are depreciated over 30 years to a 10% residual value, unless the specific circumstances of the project indicate a shorter period.
- Coal plant is considered on an individual basis.
Management regularly considers whether there are any indications of impairments of the carrying values of fixed assets (e.g. the impact of current adverse market conditions). Impairment reviews are based on discounted future cash flows that inevitably require estimates of discounts and future market prices. Joint ventures and associates Under normal accounting practice, joint ventures and associates are required to be 'equity accounted'. This involves including only the Group's share of operating profit, interest and taxation in the profit and loss account and net assets in the balance sheet, as single line items. Due to the significance of associates, there is additional disclosure in the notes to the accounts. Other All entities in which the Company has an interest are appropriately treated in the financial statements. There are no material leasing arrangements which have the effect of removing assets and related debt from the balance sheet.
FINANCIAL POSITION AND RESOURCES A summary of the Group cash flow is set out below. The figures included for the nine months ended 31 December 2000 represent the cash flows of the continuing business only.
| | | Year ended | | Nine months | | | | 31 December | | ended | | | | 2001 | | 31 December | | | | | | 2000 | | | | �m | | �m | | | Operating profit | | 163 | | 59 | | | Depreciation and amortisation | | 95 | | 40 | | | Dividends from joint ventures and associates | | 59 | | 21 | | | Working capital and provisions | | 16 | | (109) | |
| | Operating cash flow | | 333 | | 11 | | | Capital expenditure - maintenance | | (48) | | (36) | | | Tax and interest paid | | (106) | | (54) | |
| | Free cash flow | | 179 | | (79) | | | Capital expenditure - growth | | (358) | | (540) | | | Acquisitions and disposals | | 318 | | (42) | | | National Power dividend | | - | | (116) | | | Foreign exchange hedging and other | | 35 | | (33) | |
| | Movement in net debt | | 174 | | (810) | | | Opening net debt | | (1,071) | | (261) | |
| | Closing net debt | | (897) | | (1,071) | |
| | Operating cash flow for the year ended 31 December 2001 increased to �333 million as compared to �11 million for the nine months ended 31 December 2000. The principal drivers include strong operating profit performance, an increase in dividend receipts from joint ventures and associates (up from �21 million to �59 million) and a reduction in working capital and provisions. Capital expenditure on projects designed to maintain the operating capacity of our power stations was stable at �48 million on an annualised basis. Capital expenditure to increase our operating capacity amounted to �358 million as compared to �540 million for the nine months ended 31 December 2000. This programmed reduction in our capital expenditure reflects the progressive completion of our new build capacity in Massachusetts and Texas. Net interest of �105 million was paid in the year reflecting higher levels of average debt in 2001, partially offset by lower average rates of interest. Net tax payments in the year were �1 million. Acquisitions and disposals include the net proceeds of �372 million on the sale of our 25% interest in UFG and an initial payment of �67 million to TXU in respect of the acquisition of our 1,000 MW Rugeley power station in the UK. The balance of the total consideration of �200 million was paid to TXU in January 2002.
A summarised, re-classified presentation of the Group balance sheet is set out below: | | | 31 December | | 31 December | | | | 2001 | | 2000 | | | | �m | | �m | | | | | Fixed assets | | Intangibles and tangibles | | 2,622 | | 2,188 | | | Investments | | 515 | | 824 | |
| | Total fixed assets | | 3,137 | | 3,012 | | | Net current liabilities | | (320) | | (117) | | | Provisions and creditors over one year | | (68) | | (89) | | | Net debt | | (897) | | (1,071) | |
| | Net assets | | 1,852 | | 1,735 | |
| | Gearing | | 48% | | 62% | | | Debt capitalisation | | 33% | | 38% | | |
Net assets at 31 December 2001 amounted to �1,852 million, as compared to �1,735 million at 31 December 2000, reflecting the underlying profitability of the Group for the year. Net debt at 31 December 2001 of �897 million is net of facility fees of �29 million, which have been capitalised and offset against the debt in accordance with accounting standard FRS 4. The facility fees were incurred in successfully securing new debt facilities across the Group, particularly in the US and Thailand. Net debt at 31 December 2001 of �897 million is down from �1,071 million at 31 December 2000, reflecting our improved operating cash flow, a reduction in our committed capital expenditure as our US construction programme moves toward completion, and the sale of our interest in UFG for �372 million in July 2001. Gearing at 31 December 2001 was 48% (31 December 2000: 62%) and debt capitalisation was 33% (31 December 2000: 38%). 
Group net debt at 31 December comprised:
| | | 2001 | | 2000 | | | | �m | | �m | | | Cash and liquid investments | | 643 | | 107 | | | Loans - recourse | | (41) | | (399) | | | Loans - non-recourse | | (1,251) | | (544) | | | Convertible bond | | (248) | | (235) | |
| | Net debt | | (897) | | (1,071) | |
| |
The above net debt of �897 million, excludes the Group's share of joint ventures and associates debt of �487 million. In view of the significance of this amount, it has been disclosed separately. In June 2001, we completed the US$1.375 billion (�945 million) ANP credit facility to finance our 4,000 MW merchant power fleet in the US, comprising a portfolio of five generating stations located in Massachusetts and Texas. This funding structure has been assigned investment grade credit ratings by Standard & Poor's (BBB-) and Moody's (Baa3). The construction programme benefits from economies of scale arising through the use of common turbine technology and a single Engineering Procurement and Construction (EPC) contractor for all plants. This financing was a major step to enhance the capital structure of International Power. In July 2001, we completed a US$45 million (�31 million) project finance facility to re-finance our wholly owned subsidiary, Thai National Power, for the construction of our 110 MW gas-fired cogeneration plant. In October 2001, we finalised a �371 million corporate revolving credit facility with a three-year maturity. The facility increases our financial flexibility to pursue business development and acquisition opportunities. In December 2001, our joint venture with CMS Energy (of the US) and the Abu Dhabi Water and Electricity Authority (ADWEA) established a US$1.6 billion (�1.1 billion) facility to finance construction of the Shuweihat S1 power and water desalination project in Abu Dhabi. The financing structure comprises a US$1.285 billion 20-year term loan and a US$351 million equity bridge facility. The term loan includes a US$250 million Islamic tranche arranged by Abu Dhabi Islamic Bank. The arrangement of this combined conventional and Islamic financing is a major achievement for the Shuweihat sponsors, particularly given the difficult market circumstances. Pension case resolution In April 2001, the House of Lords ruled in our favour in respect of the pensions case relating to the use of the pension surplus by National Power in 1992 and 1995, for which we had contingent funding of �235 million. This contingent funding is no longer required and has been cancelled. Rating agencies In June 2001, resolution of the pension case was among the factors cited by Moody's Investors Service when the rating agency changed its outlook for our long-term debt from stable to positive. Moody's improved outlook was also supported by: our successful commissioning of plants in the US, Australia and Thailand; the Rugeley acquisition; the settlement agreements in Pakistan; improvements in the Australian power market; and the completion of the funding for our US build programme. In August 2001, Standard & Poor's reaffirmed its BB rating of our long-term corporate credit and senior unsecured debt ratings.
 TREASURY POLICY TREASURY POLICY Treasury policy seeks to ensure that adequate financial resources are available for the development of the Group's business whilst managing its currency, interest rate and counterparty credit risks. The Group's treasury policy is not to engage in speculative transactions. Group treasury acts within clearly defined guidelines that are approved by the Board. The major areas of treasury activity are set out below.
In common with other international companies, the results of the Group's foreign operations are translated into sterling at the average rates for the periods concerned. The balance sheets of foreign operations are translated into sterling at closing exchange rates. This translation has no impact on the cash flow of the Group. In order to hedge the net assets of foreign operations, borrowings are generally in the same currency as the underlying investment. The Group aims to hedge a reasonable proportion of its non-sterling assets in this way. For major currencies, it is our policy not to hedge currency translation through foreign exchange contracts or currency swaps. | | Average and year end sterling exchange rates for major currencies which are significant to the Group were: | | | | | Average | | At 31 December 2001 | | | US dollar | | 1.44 | | 1.46 | | | Australian dollar | | 2.79 | | 2.84 | | | Euro | | 1.61 | | 1.63 | | |
This arises where a business unit makes actual sales and purchases in a currency other than its functional currency. Transaction exposure also arises on the remittance from overseas of dividends or surplus funds. The Group's policy is to match transaction exposure where possible, and hedge remaining transactions as soon as they are committed, by using foreign currency contracts and similar instruments.
Surplus funds are placed for short periods in investments that carry low credit risk and are readily realisable in major currencies.
The Group's policy is to fix interest rates for a significant portion of the debt (73% as at 31 December 2001). Where project finance is utilised, our policy is to align the maturity of the debt with the contractual terms of the customer off-take agreement. Where appropriate, the Group will fix interest rates using forward rate or interest rate swap agreements. Significant interest rate management programmes and instruments require specific approval of the Board.
The Group's policy is to manage its credit exposure to trading and financial counterparties within clearly defined limits. Energy trading activities are strictly monitored and controlled through delegated authorities and procedures which include specific criteria for the management of counterparty credit exposures in each of our key regions. In addition, Group treasury manages the Group-wide counterparty credit exposure on a consolidated basis. Financial counterparty credit exposure is limited to relationship banks and commercial paper with strong investment grade credit ratings - credit exposure is regularly monitored by Group treasury. 
|  Overview of business
 REST OF WORLD