| Ten year financial summary |
| 95/96 | 96/97 | 97/98 | 98/99 | 99/00 | 00/01 | 01/02 | 02/03 | 03/04 | 04/05 |
|
| Turnover | 173,652 | 200,140 | 213,777 | 217,758 | 233,485 | 268,322 | 267,597 | 267,293 | 292,640 | 299,119 |
| Overseas sales | 104,432 | 119,235 | 126,863 | 134,189 | 150,727 | 181,831 | 183,259 | 188,161 | 206,102 | 218,745 |
| Profit before taxation, goodwill amortisation and exceptional items | 33,619 | 37,076 | 42,391 | 41,823 | 43,751 | 49,698 | 48,255 | 46,508 | 50,284 | 50,389 |
|
||||||||||
| Net tangible assets | 77,650 | 81,209 | 98,249 | 102,101 | 89,755 | 99,991 | 117,515 | 86,854 | 95,935 | 80,750 |
| Borrowings | 8,350 | 3,763 | 2,784 | 7,730 | 14,700 | 7,758 | 15,047 | 27,667 | 26,934 | 33,344 |
| Cash and short-term deposits | 27,459 | 13,447 | 22,639 | 29,894 | 21,900 | 21,484 | 45,657 | 27,574 | 48,482 | 45,348 |
| Employees | 2,384 | 2,677 | 2,861 | 2,827 | 2,975 | 3,059 | 2,859 | 2,793 | 2,925 | 3,002 |
|
||||||||||
| Earnings per ordinary share (Note 1) | 6.44p | 7.01p | 6.87p | 7.91p | 6.08p | 8.91p | 8.58p | 7.76p | 6.09p | 7.97p |
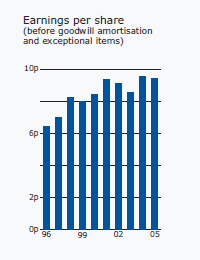
| Earnings per ordinary share before goodwill amortisation and exceptional items (Note 1) | 6.44p | 7.01p | 8.26p | 7.99p | 8.41p | 9.34p | 9.10p | 8.55p | 9.44p | 9.42p |
| Year on year increase/(decrease) in earnings per ordinary share before goodwill amortisation and exceptional items | 15.2% | 8.9% | 17.8% | (3.3%) | 5.3% | 11.1% | (2.6%) | (6.0%) | 10.4% | (0.2%) |
| Net tangible assets per ordinary share (Note 1) | 21.7p | 22.5p | 27.1p | 28.2p | 24.9p | 27.7p | 32.2p | 23.8p | 26.2p | 21.9p |
| Year on year increase/(decrease) in net tangible assets per ordinary share | 21.2% | 3.7% | 20.4% | 4.1% | (11.7%) | 11.2% | 16.2% | (26.1%) | 10.17% | (16.4%) |
| Return on sales (Note 2) | 19.4% | 18.5% | 19.8% | 19.2% | 18.7% | 18.5% | 18.0% | 17.4% | 17.2% | 16.8% |
| Return on capital employed (Note 3) | 43.3% | 45.7% | 43.1% | 41.0% | 48.7% | 49.7% | 41.1% | 53.5% | 52.4% | 62.4% |
| Year on year increase in dividends per ordinary share | 20% | 20% | 20% | 20% | 20% | 15% | 15% | 10% | 7% | 5% |
|
||||||||||
| Ordinary share price at financial year end (Note 1) | 138p | 134p | 124p | 92p | 95p | 129p | 164p | 114p | 149p | 161p |
| Market capitalisation at financial year end | £492.1m | £479.2m | £447.3m | £330.6m | £340.1m | £465.7m | £598.2m | £416.7m | £546.5m | £593.8m |
| Earnings per share (before goodwill amortisation and exceptional items)  |
Return on capital employed  |
Overseas sales |
Notes:
- Restated for the capitalisation issue made in 1997.
- Return on sales is defined as profit before taxation, goodwill amortisation and exceptional items expressed as a % of turnover.
- Return on capital employed is defined as profit before taxation, goodwill amortisation and exceptional items expressed as a % of net tangible assets (being equity shareholders' funds less intangible assets).
- Figures prior to 2000/01 have not been restated for the adoption of FRS 19 (Deferred Taxation).