Summary of Halma p.l.c. Annual report and accounts 2007

 Accounting Policies and Notes
This is a PDF - 0.15MB
To view the PDF you need either Adobe Acrobat software or the free Adobe Reader - Get Adobe Reader
To download the PDF, right click on the link, select 'Save Target As...', and then choose a folder to save the file in.
We achieved our highest ever revenue from continuing operations at £354.6 million (2006: £310.8 million), an increase of 14% over the prior year. Profit before tax and amortisation of acquired intangibles at £66.1 million (2006: £58.1 million) on our continuing operations, excluding the disposals made in the prior year, was 14% higher and was also a record.
Adjusting for the extra profit which came with acquisitions gives organic growth* of 8.1% in revenue and 7.6% in terms of profit. There was a notable currency headwind through the year and without that organic revenue and profit growth would have been 2.3% and 2.5% higher respectively. See below for more detail on currency impacts. Earnings per share were up 11% on a statutory basis and up 14% on our adjusted* basis. A year of good further progress.
As noted above there were disposals last year but none this year and so the comparative figures are for continuing operations only. We have made a minor reclassification within our sector figures, moving our Asset monitoring business into the Industrial Safety sector and details of the change are given in note 1.
Infrastructure Sensors and Industrial Safety sectors both grew revenue and profit by more than 15%. The strong performance of Infrastructure Sensors, our largest sector, was underpinned by the higher investment made last year. The Health & Analysis sector grew revenue by 9% and 7% in terms of profit*, above our target of 5% growth and following on from very strong growth in the previous year. Return on sales* for each sector remained firmly in the 18% to 21% range. Sector performances are discussed further below.
There was widespread geographic growth in revenue. The following table gives revenue from continuing operations by destination.
| £ million | Revenue | % change |
|---|---|---|
| United States of America | 98.9 | 5.1% |
| United Kingdom | 96.5 | 16.4% |
| Mainland Europe | 91.4 | 18.4% |
| Asia Pacific and Australasia | 35.5 | 6.6% |
| Africa, Near and Middle East | 22.3 | 51.5% |
| Other | 10.0 | 16.5% |
| 354.6 | 14.1% |
In the US our Health and Analysis and Industrial Safety businesses showed solid growth with Infrastructure Sensors not yet making as strong progress. In the UK, Africa, Near and Middle East, Infrastructure Sensors performed very well, as it did in Mainland Europe, with the majority of the European increase coming organically. Industrial Safety grew strongly in the UK assisted by the addition of the Tritech business. Growth in the Asia Pacific region was more modest although sales to China grew by 26% from a low base. We are putting far greater resources into this region to capture the opportunity there. Importantly, revenue outside of the US/UK/Mainland Europe grew by a further 20% as we expand our geographic coverage.
In the year we again achieved very good organic growth and at the same time maintained high returns. An important part of our strategy is the delivery of excellent returns and the strong cash flow which comes from them. These high returns have been a feature of the Group over many years, but significantly this has once again been coupled with good organic growth in these past two years.
Our returns are strong and stable. Return on capital employed (ROCE) was 60.1% (2006: 56.9%) showing the high value we generate from our tangible asset base. Return on total invested capital (ROTIC) increased to 14.0% (2006: 12.8%), this is a post-tax return on the total asset base including all historic goodwill but excluding the pension deficit. See note 3 to the accounts for the full calculation of ROCE and ROTIC. The pattern of ROTIC over the past five years is as follows:
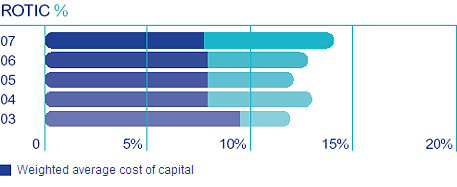
ROTIC has grown recently because we have grown earnings at a faster rate than the underlying capital base. In each year ROTIC has been well in excess of our Weighted average cost of capital (WACC) which has been calculated as currently being 7.7%.A sustained high ROTIC well above our WACC is a central element of our value creation strategy.
Once again we delivered a high Return on sales* figure at 18.6% (2006: 18.7%).We disposed of some businesses last year which generated a slightly lower margin. The Group has operated with a Return on sales* range of 16.2% to 19.8% for more than 20 years. These sustained high margins demonstrate the significant value placed on our products by our customers throughout the economic cycle.
The Group generated strong cash flow once again with cash generated from operations of £70.3 million. The following table sets out the main components of our cash flows and these are discussed in the sections below.
| £ million | 2007 | 2006 |
|---|---|---|
| Cash generated from operations | 70.3 | 70.2 |
| Acquisition of businesses | (27.5) | (36.2) |
| Disposal of businesses | - | 14.6 |
| Development costs capitalised | (3.9) | (2.5) |
| Net capital expenditure | (7.3) | (11.6) |
| Dividends paid | (25.9) | (24.5) |
| Taxation paid | (19.5) | (16.8) |
| Issue of shares/purchase of treasury shares | 3.6 | 0.6 |
| Net finance expense | (0.8) | (0.4) |
| Exchange adjustments | (0.2) | (1.9) |
| (11.2) | (8.5) | |
| Net cash brought forward | 3.5 | 12.0 |
| Net (debt)/cash carried forward | (7.7) | 3.5 |
The Group finances its operations from retained earnings and has access to third party borrowings when needed. There are no material funds outside the UK where repatriation is restricted. Our treasury policies seek to minimise financial risks and ensure sufficient liquidity. No speculative transactions are undertaken. Foreign currency profits are not hedged but purchase and sale transactions are hedged into the functional currency of the relevant operating company and balance sheet net currency assets are substantially hedged.
We continued to implement our strategy of acquiring successful businesses and helping them grow. In particular, we offer businesses an autonomous environment within which to continue their record of success. We spent £27.5 million on acquisitions in the year of which £8.2 million related to the payment of deferred consideration on acquisitions made in previous years. Acquisitions made in the year have met or exceeded our expectations.
The largest acquisitions in the year were of Tritech/System Technologies and Labsphere. We acquired Tritech/System Technologies, who design and manufacture underwater asset monitoring equipment, in November 2006. Their 2005 audited accounts showed annual revenue of £5.4 million and profit of £1.1 million on a combined basis, with further encouraging growth since that time. We paid an initial consideration of £10 million, with a further potential payment of up to £4.5 million conditional on substantial future growth.
Labsphere, a world leader in light testing and measurement products, was acquired in February 2007 for a cash consideration of US$14.3 million (£7.2 million). There are no additional payments to make for this acquisition. Labspheres unaudited accounts for 2006 show revenues of US$12.5 million (£6.3 million) and operating profit of US$2.4 million (£1.2 million).
In the year we also acquired Mikropack, which makes light sources and photonic accessories, for €2.3 million (£1.5 million) and Baldwin Environmental for US$1.1 million (£0.6 million) with a potential further total of £1.9 million payable on the two acquisitions if performance targets are met. All of these acquisitions were immediately earnings enhancing and were generating a rate of return in excess of our WACC at the time of acquisition. We continue to invest considerable resources into identifying further acquisitions in our chosen markets.
We spent £10.9 million on property, plant and computer software in the year, a lower figure than the high expenditure last year representing 134% of depreciation/amortisation - a more typical level for the Group. Two surplus properties sold during the year increased disposal proceeds. In 2007/08 we expect to undertake two specific property developments at separate subsidiaries which should add to the underlying rate of capital investment and also produce a small gain on a property disposal.
The Board has recommended a further 5% increase in the final dividend up to 4.33p which together with the interim dividend (also 5% higher) will give a total dividend of 7.18p for the year, assuming the final dividend is approved. This will mean a total payout to the shareholders in dividends of £26.7 million in relation to the year ended 31 March 2007. This continues our progressive dividend policy stretching back many years. It also furthers our objective of increasing dividend cover (based on profit from continuing operations before amortisation of acquired intangible assets) towards a figure of around 2.0 over time, by lifting the cover from 1.61 to 1.74 times.
The effective tax rate on profit from continuing operations (before amortisation of acquired intangible assets) is very similar to last year at 29.8% (2006: 30.1%). Future effective tax rates are more likely to be higher although not significantly so.
As indicated last year we have increased the rate of contributions into our defined benefit pension plans which were closed to new entrants in 2003. An additional £3 million was paid into the plans in the year and over the next couple of years we expect the annual cash contributions to continue to increase by a further £2 million so that we can meet our objective of paying off the deficit, as measured on an IAS 19 basis, over a ten-year period. These extra contributions are not insignificant but are not expected to impair our growth opportunities. The pension deficit on an IAS 19 basis reported in the accounts has reduced from £46 million last year to £37 million at year end, before the related deferred tax asset. This decrease arises from an increase in the value of plan assets, helped by the additional contributions, offset by proportionately less of an increase in the present value of plan liabilities due to a higher discount rate being applied.
We finished the year with a modest level of gearing at £7.7 million (2006: £3.5 million net cash). This begins to utilise the £60 million five-year debt facility put in place last year with our well established banking partners. The Board would be willing to utilise more of this facility if good acquisition and investment opportunities are identified. The Group continues to be able to borrow at competitive rates and therefore currently deems this to be the most effective method of funding our increasing investment.
There was a currency headwind through the year, particularly in the second half. Approximately one-third of Group revenue is denominated in US Dollars and 15% in Euros with the US Dollar recently showing significant adverse movement relative to Sterling. We translated our US Dollar revenue and profit to Sterling at an average rate of 1.78 in 2005/06 but in 2006/07 this average was 1.89. As a guide, a 1% weakening of the US Dollar relative to Sterling is expected to reduce revenue by approximately £1 million and profit by £0.2 million in a full year. The adverse movement in the South African Rand relative to Sterling in the year also reduced profitability in our Infrastructure Sensors business which has a sizable operation in South Africa. As previously indicated there has been an adverse impact in translating our results into Sterling which we estimate as reducing revenue by 2.3% and profit by 2.5% and most of this impact has fallen in the second half of the year. If current exchange rates prevail, our results will continue to be adversely impacted, particularly in the first half of the current financial year
The impact of currency movements on the Groups net tangible assets is largely offset by the currency hedging loans we have in place.
Amongst the operating sectors it is the Health and Analysis sector which has the biggest trading exposure to the US Dollar both in terms of origin and destination of its business. The Health and Analysis businesses generate 45% of their revenue from the US compared with 21% for Infrastructure Sensors and 16% for Industrial Safety. This gives an indication of the relative impact of US Dollar movement and it is the profitability of the Health and Analysis sector which was hardest hit by the fall in the US Dollar relative to Sterling in 2006/07.
We continue to invest heavily in Research & Development (R&D) and are active in promoting an innovative culture across the Group. Expenditure on R&D in the year was 4.3% of revenue (2006: 4.3% of revenue) and amounted to £15.3 million, 14% up on last year for continuing operations. We do not specifically capture the expenditure on all innovation as it permeates every aspect of our activities but this is an increasing use of existing and new resources. The Sector reviews on pages 22 to 27 show the percentage of revenue spent in each sector on R&D as one of our KPIs. They show that relative to our growing revenue our spend this year is consistent with last year and that the Health and Analysis sector continues to invest the highest percentage at 5.3%.
Under International Financial Reporting Standards (IFRS) we are required to capitalise certain development expenditure on the Consolidated balance sheet and also to amortise that asset over an appropriate period. In the year we capitalised £3.9 million of such development expenditure and amortised £1.5 million, giving rise to an asset of £6.1 million in the March 2007 balance sheet. The nature of R&D is that it involves risk and therefore we carefully monitor all costs carried on the balance sheet. The Consolidated income statement was charged with a cost 4% higher than last year. This increasing rate of investment in new, innovative products underpins our future growth.
We have taken a big step forward in China this year in terms of getting more high quality resource on the ground. The Asia Pacific region contributes only 10% of our total revenue, with China as a small part of this. We see substantial opportunity for many of our products in this region and so the extra investment in China, around £0.5 million more in 2006/07, is an important part of the growth process. Our task in 2007/08 and beyond is accelerating the payback on this investment.
We spread our risks in part by operating through a number of closely managed individual businesses. The main risks and uncertainties facing Halma are discussed above in this Business and financial review. We have high quality local teams guiding each business within our overall reporting and control framework. There is significant external review of these operations and one element of that review process, our Internal Audit, has been further enhanced this year by more in-depth visits. Each business has a senior finance executive on site who plays an important part in the control and growth of the business. We continue to actively develop our people and we have now had 13 of our senior finance staff graduate from the Halma Executive Development Programme (HEDP) and are finding them able to make an even broader contribution to the progress of the business.
Our impact on the environment is low and we produce many products which themselves have a positive impact. Carbon emissions reduction seems to be important for the future and we are putting in place a variety of actions to both monitor and actively manage our carbon footprint. We are at the early stages of formulating reliable measures and KPIs, but are making good progress and this is discussed more fully on pages 30 and 31. We take a broader view that our impact on the environment is not just in relation to carbon emissions but also water usage, packaging and waste generally, all areas where we have a good record.
Not only should we be able to comply with regulations as they develop but also we are focussing our efforts in this area on increasing profitability and genuinely improving our business. Improving further in these areas should deliver greater value for customers and shareholders.
Kevin Thompson Finance Director