
BP - Health & Safety Data homepage
DAFWCF (Group)
DAFWC (Group)
RIF (Group)
RI (Group)
Fatality rate (Group)
Fatalities (Group)
Cumulative change (All rates)
Business segment comparisons (RI)
Business segment comparisons (DAFWC)
|
|
|
BP - Health & Safety Data
|
|
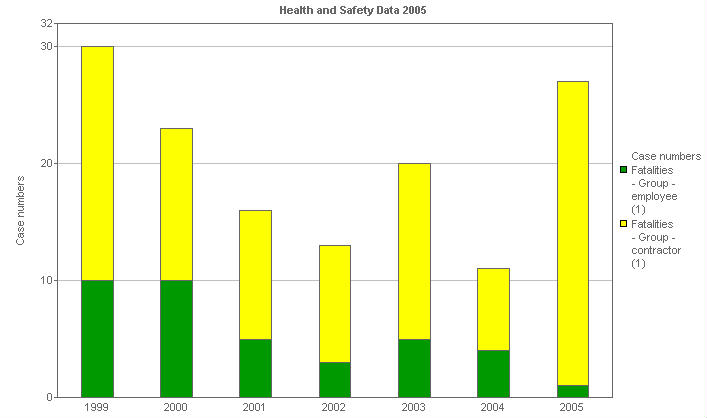
Fatalities (Group)
This stacked bar chart shows the total number of fatalities, analyzed by employee and contractor, for BP Group.
|
|
 |
|
| | Units | 1999 | 2000 | 2001 | 2002 | 2003 | 2004 |
|---|
| Fatalities - Group - workforce (1) | Case numbers | 30 | 23 | 16 | 13 | 20 | 11 |
|---|
| Fatalities - Group - employee (1) | Case numbers | 10 | 10 | 5 | 3 | 5 | 4 |
|---|
| Fatalities - Group - contractor (1) | Case numbers | 20 | 13 | 11 | 10 | 15 | 7 |
|---|
| | Units | 2005 |
|---|
| Fatalities - Group - workforce (1) | Case numbers | 27 |
|---|
| Fatalities - Group - employee (1) | Case numbers | 1 |
|---|
| Fatalities - Group - contractor (1) | Case numbers | 26 |
|---|
(1) Fatalities - Total number of fatalities, by employee and contractor, for BP Group.
|
|
